Dask cluster configuration tips#
LSDB uses the Dask framework for parallel and out-of-memory computing. Dask is a flexible library for parallel computing in Python that scales from single machines to large clusters. When using LSDB, it is usually worth setting up a Dask cluster (local or multi-node) to take advantage of parallel computing. With no Dask cluster, LSDB would use a single CPU core for the computations, which is prohibitive for large datasets.
Here, we provide some tips on how to set up a Dask cluster for LSDB computations. Note that Dask also provides its own best practices, which may also be useful to consult.
Local Cluster on Single Machine or Node#
Even on a single machine, Dask recommends using their distributed cluster. This simple example runs a local cluster and starts a client connected to it.
from dask.distributed import Client
from lsdb import open_catalog, ConeSearch

catalog = lsdb.open_catalog(
    'https://data.lsdb.io/hats/gaia_dr3/gaia',
    search_filter=ConeSearch(ra=0, dec=0, radius=1),
)
client = Client()
df = catalog.compute()
client.close()
Here, Client() would create and start a LocalCluster,
and initialize a client session connected to it.
When no parameters are provided, Dask would typically allocate multiple workers, and set number of Python threads and
memory limit to match your machine configuration.
As you run more computationally intensive graphs, you will want to consider configuring the cluster
to better distribute your machine’s resources.
Setting workers and threads#
Usually the client initialization would look like this:
from dask.distributed import Client

# Create a local cluster and connect to it
client = Client(
    # Number of Dask workers - Python processes to run
    n_workers=16,
    # Limits number of Python threads per worker
    threads_per_worker=2,
    # Memory limit, per worker, which here is also 10 GB per worker thread
    memory_limit="20GB",
)
client
In general, increasing the number of workers executing tasks in your graph in parallel is more beneficial
than increasing the number of threads available for each worker.
In your cluster configuration, it is preferable to increase the number of workers (n_workers) while
keeping threads_per_worker small (e.g., 1 or 2 threads per worker).
The threads_per_worker parameter determines the number of Dask tasks each worker can process concurrently.
Larger values may lead to higher memory consumption.
Despite its name, threads_per_worker does not limit the number of CPU cores a worker can use
but instead sets the number of Python threads the worker runs.
The number of Python threads is a trade-off between minimizing inter-worker data transfer and improving
parallel processing efficiency.
We recommend keeping threads_per_worker small because LSDB pipelines typically do not transfer data frequently,
and using a larger number of Python threads may increase
Global Interpreter Lock (GIL) contention.
Additionally, the underlying LSDB (e.g., Parquet reading) and user code may utilize more than one CPU
core per Python thread.
Setting memory limits#
Usage of lsdb.open_catalog(columns=..., filters=...) may make the memory footprint much smaller, which would
allow you to allocate less memory per worker, and thus use more workers and make the analysis run faster.
When executing custom code/functions through LSDB’s interface, keep in mind that any intermediate products created in that function affect the memory footprint of the overall workflow. For example, in the below example our code copies a dataframe input effectively doubling the amount of input memory. Being aware of the memory performance of your analysis code is highly encouraged for general LSDB/Dask performance, and memory allocation may need to be increased accordingly.
def my_func(df):
    df2 = df.copy()
    return df2.query("a>5")

new_catalog = catalog.map_partitions(my_func)
How you configure Dask memory limits also depends on where you are running.
On managed platforms where the scheduler enforces a strict memory cap for the
entire allocation (for example, a SLURM job with a fixed memory request),
setting memory_limit=None on the client can be a practical strategy. This
removes per-worker caps so a single worker can temporarily use more memory to
gather results near the end of a workflow, while the overall job is still
bounded by the scheduler. On unmanaged shared nodes, avoid this setting because
it can allow a single job to overrun the machine and disrupt other users.
from dask.distributed import Client

# Use only on managed allocations with a strict total memory limit.
client = Client(n_workers=8, threads_per_worker=1, memory_limit=None)
Multiple Node Cluster#
With multiple nodes, you would usually have a scheduler running on one node and Dask workers being distributed across the nodes. In this case each computational node would run one or more Dask workers, while each worker may take few Dask tasks (usually one per LSDB partition) and use multiple threads.
Please see the Dask and dask-jobqueue documentation for more details about how to run Dask on multiple nodes.
High-Performance Computing Cluster with SLURM#
The Dask ecosystem has a dask-jobqueue package that allows users to run Dask on HPC clusters.
It provides a way to submit Dask workers as SLURM jobs, and to scale the number of workers dynamically.
Unfortunately, dask-jobqueue does not support selecting both the number of SLURM job cores
and Dask threads per worker separately.
We found it may be a problem for some SLURM clusters that require to specify the exact number of cores and memory per job.
The following configuration is an example that was run on Pittsburgh Supercomputing Center,
and contains some specific settings useful for the hardware of that cluster.
This configuration runs 60 SLURM jobs, each with a single Dask worker (processes variable below),
and each worker uses 3 threads (worker_process_threads variable below).
On this particular SLURM queue (sometimes called “partition” or “allocation”) each node has 2GB of RAM per core,
so we ask for 32GB of RAM and 16 cores per job.
class Job(dask_jobqueue.slurm.SLURMJob):
    # Rewrite the default, which is a property equal to cores/processes
    worker_process_threads = 3

class Cluster(dask_jobqueue.SLURMCluster):
    job_cls = Job

gb_per_job = 32
jobs = 60
processes = 1  # Single dask worker per slurm job
gb_per_core = 2  # PSC "regular memory" nodes provide fixed 2GB / core
cluster = Cluster(
    # Number of Dask workers per node
    processes=processes,
    # Regular memory node type on PSC bridges2
    queue="RM-shared",
    # dask_jobqueue requires cores and memory to be specified
    # We set them to match RM specs
    cores=gb_per_job // gb_per_core,
    memory=f"{gb_per_job}GB",
    # Maximum walltime for the job, 6 hours.
    # SLURM will kill the job if it runs longer
    walltime="6:00:00",
)

# Run multiple jobs
cluster.scale(jobs=jobs)

# Alternatively to cluster.scale, can use adapt to run more jobs
# cluster.adapt(maximum_jobs=100)

client = dask.distributed.Client(cluster)

# Your code, running catalog.compute() or catalog.write_catalog()
# df = catalog.compute()

# Stop the cluster, it would ask SLURM to shut all the jobs down
cluster.close()
# Close the client
client.close()
So this configuration would allocate 60 SLURM jobs, with 60 Dask workers, which would create 180 Python threads, run on 960 CPU cores, and use 1920 GB of RAM in total. As you see, the number of CPU cores is significantly larger than the number of Python threads. This is a trick we use to get more RAM per each task, which is crucial for LSDB pipelines. As was mentioned earlier, LSDB pipelines may still utilize multiple CPU cores per a single Python thread, thanks to internal multithreading of underlying libraries, such as NumPy and PyArrow.
Dask Dashboard#
Dask output logs and the Dask Dashboard are both great ways to monitor and debug the pipeline. The dashboard is run automatically by Dask. Typically, the dashboard would be accessible at http://127.0.0.1:8787/status, but if port 8787 is already in use, Dask will automatically choose a different port.
Here is how you can get the Dashboard link using the Client object:
client = Client(n_workers=4, threads_per_worker=1)
print(client.dashboard_link)
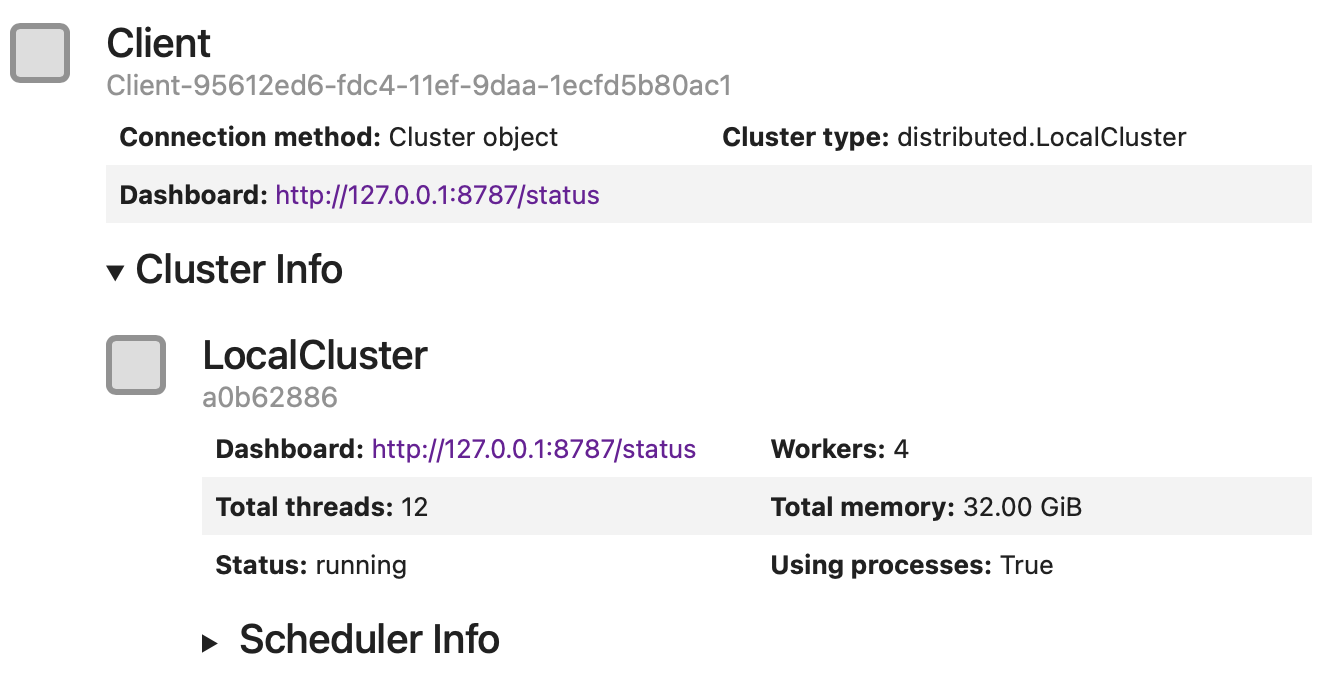
In a Jupyter Notebook you can also display the client object, by making it the last line of your code or using the display function:
client = Client(n_workers=4, threads_per_worker=1)
display(client)
The Dashboard shows a lot of useful information, such as task progress (bar-charts on the right-hand side), number of tasks per worker (bottom left) and memory usage (top and center left).
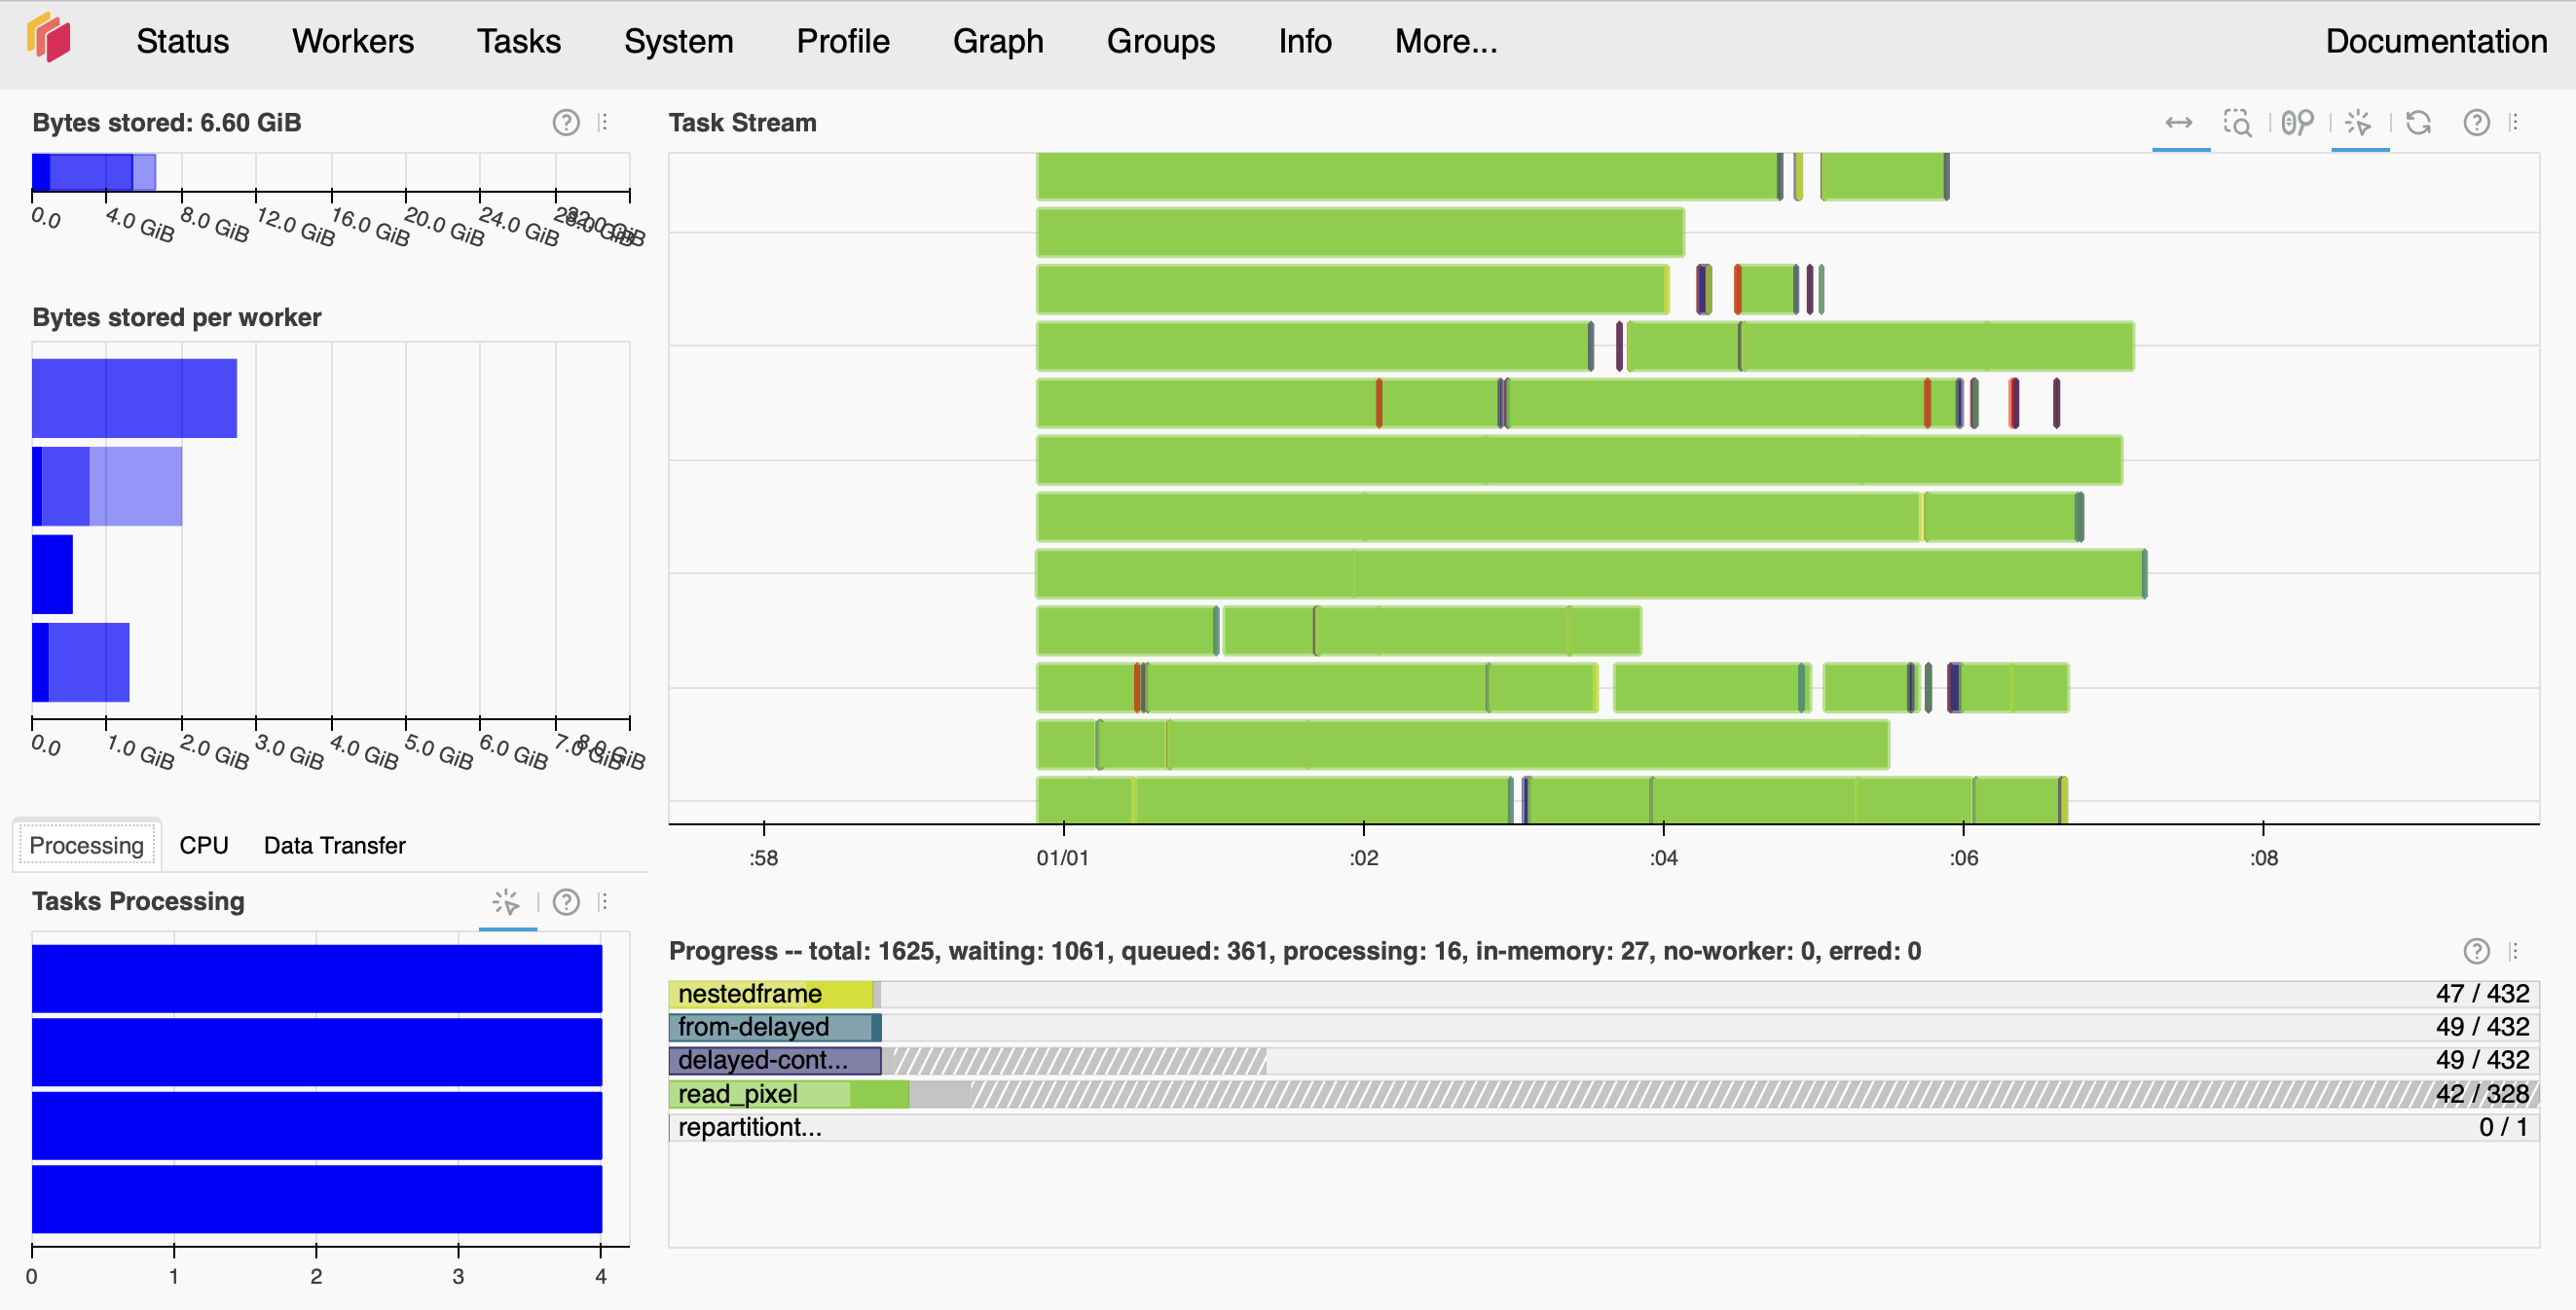
If you see that memory bars are colored red, it means that the workers are running out of memory.
The Workers page shows the status of each worker, including their memory, CPU, and network usage.
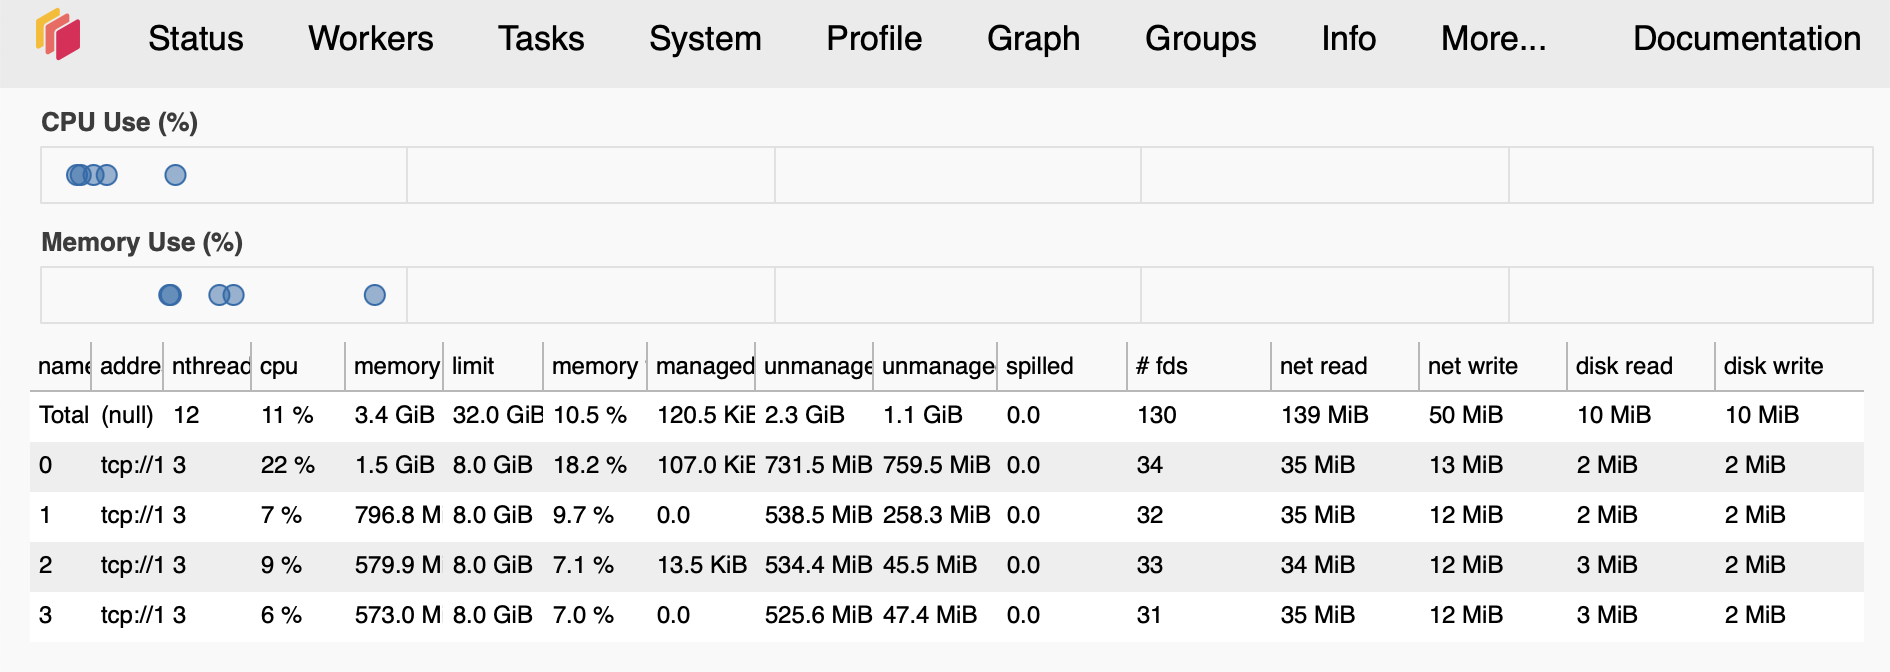
If you see that the total number of workers is less than the number of workers you requested, it means that the workers were killed or died. This may happen if workers overused their memory limit or, in multiple-node clusters, because of network issues. Increasing the memory limit and network timeouts may help keep workers alive.