Visualizing Periodic Lightcurves#
In this tutorial, we will:
follow a guided walkthrough for visualizing lightcurves of a set of known periodic objects
crossmatch an object list with Rubin data using LSDB catalogs
Introduction#
This notebook demonstrates how to visualize lightcurves for periodic objects in the Rubin DP1 data.
[1]:
import astropy.units as u
import lsdb
import matplotlib.pyplot as plt
import numpy as np
import pandas as pd

from dask.distributed import Client
from io import StringIO
from upath import UPath

import warnings

# Disable plotting warnings
warnings.filterwarnings("ignore")
The Rubin HATS catalogs#
HATS (HEALPix Adaptive Tiling Scheme) is a HEALPix-based parquet format that enables fast parallelization of large scale workflows.
The data was imported and post-processed by the DASH pipeline.
It includes added-value columns for scientific use - e.g. PSF and science magnitudes, and timestamps for every source / forced source.
[2]:
hats_path = UPath("/rubin/lsdb_data")
diaobject_path = hats_path / "dia_object_collection"
object_path = hats_path / "object_collection"
Load the Rubin DP1 Catalog#
The relevant catalogs are diaObject and object. Each row corresponds to a single object with all its sources and nested sources embedded in separate columns.
[3]:
# Load DiaObject Collection
dia_catalog = lsdb.open_catalog(diaobject_path)
dia_catalog
[3]:
| dec | diaObjectId | nDiaSources | ra | radecMjdTai | tract | diaObjectForcedSource | diaSource | |
|---|---|---|---|---|---|---|---|---|
| npartitions=208 | ||||||||
| Order: 6, Pixel: 130 | double[pyarrow] | int64[pyarrow] | int64[pyarrow] | double[pyarrow] | double[pyarrow] | int64[pyarrow] | nested<band: [string], coord_dec: [double], co... | nested<band: [string], centroid_flag: [bool], ... |
| Order: 6, Pixel: 136 | ... | ... | ... | ... | ... | ... | ... | ... |
| ... | ... | ... | ... | ... | ... | ... | ... | ... |
| Order: 11, Pixel: 36833621 | ... | ... | ... | ... | ... | ... | ... | ... |
| Order: 7, Pixel: 143884 | ... | ... | ... | ... | ... | ... | ... | ... |
[4]:
# Load Object Collection
obj_catalog = lsdb.open_catalog(object_path)
obj_catalog
[4]:
| coord_dec | coord_decErr | coord_ra | coord_raErr | g_psfFlux | g_psfFluxErr | g_psfMag | g_psfMagErr | i_psfFlux | i_psfFluxErr | i_psfMag | i_psfMagErr | objectId | patch | r_psfFlux | r_psfFluxErr | r_psfMag | r_psfMagErr | refBand | refFwhm | shape_flag | shape_xx | shape_xy | shape_yy | tract | u_psfFlux | u_psfFluxErr | u_psfMag | u_psfMagErr | x | xErr | y | y_psfFlux | y_psfFluxErr | y_psfMag | y_psfMagErr | yErr | z_psfFlux | z_psfFluxErr | z_psfMag | z_psfMagErr | objectForcedSource | |
|---|---|---|---|---|---|---|---|---|---|---|---|---|---|---|---|---|---|---|---|---|---|---|---|---|---|---|---|---|---|---|---|---|---|---|---|---|---|---|---|---|---|---|
| npartitions=389 | ||||||||||||||||||||||||||||||||||||||||||
| Order: 6, Pixel: 130 | double[pyarrow] | float[pyarrow] | double[pyarrow] | float[pyarrow] | float[pyarrow] | float[pyarrow] | float[pyarrow] | float[pyarrow] | float[pyarrow] | float[pyarrow] | float[pyarrow] | float[pyarrow] | int64[pyarrow] | int64[pyarrow] | float[pyarrow] | float[pyarrow] | float[pyarrow] | float[pyarrow] | string[pyarrow] | float[pyarrow] | bool[pyarrow] | float[pyarrow] | float[pyarrow] | float[pyarrow] | int64[pyarrow] | float[pyarrow] | float[pyarrow] | float[pyarrow] | float[pyarrow] | double[pyarrow] | float[pyarrow] | double[pyarrow] | float[pyarrow] | float[pyarrow] | float[pyarrow] | float[pyarrow] | float[pyarrow] | float[pyarrow] | float[pyarrow] | float[pyarrow] | float[pyarrow] | nested<coord_ra: [double], coord_dec: [double]... |
| Order: 8, Pixel: 2176 | ... | ... | ... | ... | ... | ... | ... | ... | ... | ... | ... | ... | ... | ... | ... | ... | ... | ... | ... | ... | ... | ... | ... | ... | ... | ... | ... | ... | ... | ... | ... | ... | ... | ... | ... | ... | ... | ... | ... | ... | ... | ... |
| ... | ... | ... | ... | ... | ... | ... | ... | ... | ... | ... | ... | ... | ... | ... | ... | ... | ... | ... | ... | ... | ... | ... | ... | ... | ... | ... | ... | ... | ... | ... | ... | ... | ... | ... | ... | ... | ... | ... | ... | ... | ... | ... |
| Order: 9, Pixel: 2302101 | ... | ... | ... | ... | ... | ... | ... | ... | ... | ... | ... | ... | ... | ... | ... | ... | ... | ... | ... | ... | ... | ... | ... | ... | ... | ... | ... | ... | ... | ... | ... | ... | ... | ... | ... | ... | ... | ... | ... | ... | ... | ... |
| Order: 7, Pixel: 143884 | ... | ... | ... | ... | ... | ... | ... | ... | ... | ... | ... | ... | ... | ... | ... | ... | ... | ... | ... | ... | ... | ... | ... | ... | ... | ... | ... | ... | ... | ... | ... | ... | ... | ... | ... | ... | ... | ... | ... | ... | ... | ... |
Choose the variable objects#
We have a selection of 10 variable objects, which were found from previous analysis of forced photometry on science images:
[5]:
variables_csv = """ra,dec,period
94.95546,-24.73952,0.12095
95.30235,-25.27431,0.12248
94.91626,-24.69648,0.12038
95.12418,-25.04329,0.23554
58.83506,-48.79122,0.56335
94.92264,-25.23185,0.07672
94.72086,-25.05767,0.17559
94.97073,-25.13643,0.12048
59.12997,-48.78522,0.11628
94.72086,-25.05767,0.17554
"""
# We add the index as a column of the DataFrame so we can later retrieve
# all the Rubin data from difference and science imaging
variables_df = pd.read_csv(StringIO(variables_csv)).reset_index()
# Transform the DataFrame into a LSDB Catalog
variables_catalog = lsdb.from_dataframe(variables_df)
variables_catalog
[5]:
| index | ra | dec | period | |
|---|---|---|---|---|
| npartitions=2 | ||||
| Order: 2, Pixel: 80 | int64[pyarrow] | double[pyarrow] | double[pyarrow] | double[pyarrow] |
| Order: 5, Pixel: 8582 | ... | ... | ... | ... |
Crossmatch the data#
Let’s crossmatch the Rubin data with our desired variable objects:
[6]:
XMATCH_RADIUS_ARCSEC = 0.2
variable_object = variables_catalog.crossmatch(
    obj_catalog, radius_arcsec=XMATCH_RADIUS_ARCSEC, suffixes=["_var", ""]
)
variable_dia = variables_catalog.crossmatch(
    dia_catalog, radius_arcsec=XMATCH_RADIUS_ARCSEC, suffixes=["_var", ""]
)
# The result will have all the columns in obj_catalog suffixed with `_obj`,
# all the columns in dia_catalog suffixed with `_dia`, as well as all the
# columns in `variables_df` suffixed with `_var_obj`
result = variable_object.join(
    variable_dia, left_on="index_var", right_on="index_var", suffixes=["_obj", "_dia"]
)
result
[6]:
| index_var_obj | ra_var_obj | dec_var_obj | period_var_obj | coord_dec_obj | coord_decErr_obj | coord_ra_obj | coord_raErr_obj | g_psfFlux_obj | g_psfFluxErr_obj | g_psfMag_obj | g_psfMagErr_obj | i_psfFlux_obj | i_psfFluxErr_obj | i_psfMag_obj | i_psfMagErr_obj | objectId_obj | patch_obj | r_psfFlux_obj | r_psfFluxErr_obj | r_psfMag_obj | r_psfMagErr_obj | refBand_obj | refFwhm_obj | shape_flag_obj | shape_xx_obj | shape_xy_obj | shape_yy_obj | tract_obj | u_psfFlux_obj | u_psfFluxErr_obj | u_psfMag_obj | u_psfMagErr_obj | x_obj | xErr_obj | y_obj | y_psfFlux_obj | y_psfFluxErr_obj | y_psfMag_obj | y_psfMagErr_obj | yErr_obj | z_psfFlux_obj | z_psfFluxErr_obj | z_psfMag_obj | z_psfMagErr_obj | objectForcedSource_obj | _dist_arcsec_obj | index_var_dia | ra_var_dia | dec_var_dia | period_var_dia | dec_dia | diaObjectId_dia | nDiaSources_dia | ra_dia | radecMjdTai_dia | tract_dia | diaObjectForcedSource_dia | diaSource_dia | _dist_arcsec_dia | |
|---|---|---|---|---|---|---|---|---|---|---|---|---|---|---|---|---|---|---|---|---|---|---|---|---|---|---|---|---|---|---|---|---|---|---|---|---|---|---|---|---|---|---|---|---|---|---|---|---|---|---|---|---|---|---|---|---|---|---|---|---|
| npartitions=8 | ||||||||||||||||||||||||||||||||||||||||||||||||||||||||||||
| Order: 8, Pixel: 329721 | int64[pyarrow] | double[pyarrow] | double[pyarrow] | double[pyarrow] | double[pyarrow] | float[pyarrow] | double[pyarrow] | float[pyarrow] | float[pyarrow] | float[pyarrow] | float[pyarrow] | float[pyarrow] | float[pyarrow] | float[pyarrow] | float[pyarrow] | float[pyarrow] | int64[pyarrow] | int64[pyarrow] | float[pyarrow] | float[pyarrow] | float[pyarrow] | float[pyarrow] | string[pyarrow] | float[pyarrow] | bool[pyarrow] | float[pyarrow] | float[pyarrow] | float[pyarrow] | int64[pyarrow] | float[pyarrow] | float[pyarrow] | float[pyarrow] | float[pyarrow] | double[pyarrow] | float[pyarrow] | double[pyarrow] | float[pyarrow] | float[pyarrow] | float[pyarrow] | float[pyarrow] | float[pyarrow] | float[pyarrow] | float[pyarrow] | float[pyarrow] | float[pyarrow] | nested<coord_ra: [double], coord_dec: [double]... | double[pyarrow] | int64[pyarrow] | double[pyarrow] | double[pyarrow] | double[pyarrow] | double[pyarrow] | int64[pyarrow] | int64[pyarrow] | double[pyarrow] | double[pyarrow] | int64[pyarrow] | nested<band: [string], coord_dec: [double], co... | nested<band: [string], centroid_flag: [bool], ... | double[pyarrow] |
| Order: 9, Pixel: 1324352 | ... | ... | ... | ... | ... | ... | ... | ... | ... | ... | ... | ... | ... | ... | ... | ... | ... | ... | ... | ... | ... | ... | ... | ... | ... | ... | ... | ... | ... | ... | ... | ... | ... | ... | ... | ... | ... | ... | ... | ... | ... | ... | ... | ... | ... | ... | ... | ... | ... | ... | ... | ... | ... | ... | ... | ... | ... | ... | ... | ... |
| ... | ... | ... | ... | ... | ... | ... | ... | ... | ... | ... | ... | ... | ... | ... | ... | ... | ... | ... | ... | ... | ... | ... | ... | ... | ... | ... | ... | ... | ... | ... | ... | ... | ... | ... | ... | ... | ... | ... | ... | ... | ... | ... | ... | ... | ... | ... | ... | ... | ... | ... | ... | ... | ... | ... | ... | ... | ... | ... | ... | ... |
| Order: 9, Pixel: 2197038 | ... | ... | ... | ... | ... | ... | ... | ... | ... | ... | ... | ... | ... | ... | ... | ... | ... | ... | ... | ... | ... | ... | ... | ... | ... | ... | ... | ... | ... | ... | ... | ... | ... | ... | ... | ... | ... | ... | ... | ... | ... | ... | ... | ... | ... | ... | ... | ... | ... | ... | ... | ... | ... | ... | ... | ... | ... | ... | ... | ... |
| Order: 9, Pixel: 2197120 | ... | ... | ... | ... | ... | ... | ... | ... | ... | ... | ... | ... | ... | ... | ... | ... | ... | ... | ... | ... | ... | ... | ... | ... | ... | ... | ... | ... | ... | ... | ... | ... | ... | ... | ... | ... | ... | ... | ... | ... | ... | ... | ... | ... | ... | ... | ... | ... | ... | ... | ... | ... | ... | ... | ... | ... | ... | ... | ... | ... |
And apply filtering according to the quality flags:
[7]:
for column in ["objectForcedSource_obj", "diaSource_dia", "diaObjectForcedSource_dia"]:
    result = result.query(
        f"~{column}.psfFlux_flag"
        f" and ~{column}.pixelFlags_saturated"
        f" and ~{column}.pixelFlags_cr"
        f" and ~{column}.pixelFlags_bad"
    )
result
[7]:
| index_var_obj | ra_var_obj | dec_var_obj | period_var_obj | coord_dec_obj | coord_decErr_obj | coord_ra_obj | coord_raErr_obj | g_psfFlux_obj | g_psfFluxErr_obj | g_psfMag_obj | g_psfMagErr_obj | i_psfFlux_obj | i_psfFluxErr_obj | i_psfMag_obj | i_psfMagErr_obj | objectId_obj | patch_obj | r_psfFlux_obj | r_psfFluxErr_obj | r_psfMag_obj | r_psfMagErr_obj | refBand_obj | refFwhm_obj | shape_flag_obj | shape_xx_obj | shape_xy_obj | shape_yy_obj | tract_obj | u_psfFlux_obj | u_psfFluxErr_obj | u_psfMag_obj | u_psfMagErr_obj | x_obj | xErr_obj | y_obj | y_psfFlux_obj | y_psfFluxErr_obj | y_psfMag_obj | y_psfMagErr_obj | yErr_obj | z_psfFlux_obj | z_psfFluxErr_obj | z_psfMag_obj | z_psfMagErr_obj | objectForcedSource_obj | _dist_arcsec_obj | index_var_dia | ra_var_dia | dec_var_dia | period_var_dia | dec_dia | diaObjectId_dia | nDiaSources_dia | ra_dia | radecMjdTai_dia | tract_dia | diaObjectForcedSource_dia | diaSource_dia | _dist_arcsec_dia | |
|---|---|---|---|---|---|---|---|---|---|---|---|---|---|---|---|---|---|---|---|---|---|---|---|---|---|---|---|---|---|---|---|---|---|---|---|---|---|---|---|---|---|---|---|---|---|---|---|---|---|---|---|---|---|---|---|---|---|---|---|---|
| npartitions=8 | ||||||||||||||||||||||||||||||||||||||||||||||||||||||||||||
| Order: 8, Pixel: 329721 | int64[pyarrow] | double[pyarrow] | double[pyarrow] | double[pyarrow] | double[pyarrow] | float[pyarrow] | double[pyarrow] | float[pyarrow] | float[pyarrow] | float[pyarrow] | float[pyarrow] | float[pyarrow] | float[pyarrow] | float[pyarrow] | float[pyarrow] | float[pyarrow] | int64[pyarrow] | int64[pyarrow] | float[pyarrow] | float[pyarrow] | float[pyarrow] | float[pyarrow] | string[pyarrow] | float[pyarrow] | bool[pyarrow] | float[pyarrow] | float[pyarrow] | float[pyarrow] | int64[pyarrow] | float[pyarrow] | float[pyarrow] | float[pyarrow] | float[pyarrow] | double[pyarrow] | float[pyarrow] | double[pyarrow] | float[pyarrow] | float[pyarrow] | float[pyarrow] | float[pyarrow] | float[pyarrow] | float[pyarrow] | float[pyarrow] | float[pyarrow] | float[pyarrow] | nested<coord_ra: [double], coord_dec: [double]... | double[pyarrow] | int64[pyarrow] | double[pyarrow] | double[pyarrow] | double[pyarrow] | double[pyarrow] | int64[pyarrow] | int64[pyarrow] | double[pyarrow] | double[pyarrow] | int64[pyarrow] | nested<band: [string], coord_dec: [double], co... | nested<band: [string], centroid_flag: [bool], ... | double[pyarrow] |
| Order: 9, Pixel: 1324352 | ... | ... | ... | ... | ... | ... | ... | ... | ... | ... | ... | ... | ... | ... | ... | ... | ... | ... | ... | ... | ... | ... | ... | ... | ... | ... | ... | ... | ... | ... | ... | ... | ... | ... | ... | ... | ... | ... | ... | ... | ... | ... | ... | ... | ... | ... | ... | ... | ... | ... | ... | ... | ... | ... | ... | ... | ... | ... | ... | ... |
| ... | ... | ... | ... | ... | ... | ... | ... | ... | ... | ... | ... | ... | ... | ... | ... | ... | ... | ... | ... | ... | ... | ... | ... | ... | ... | ... | ... | ... | ... | ... | ... | ... | ... | ... | ... | ... | ... | ... | ... | ... | ... | ... | ... | ... | ... | ... | ... | ... | ... | ... | ... | ... | ... | ... | ... | ... | ... | ... | ... | ... |
| Order: 9, Pixel: 2197038 | ... | ... | ... | ... | ... | ... | ... | ... | ... | ... | ... | ... | ... | ... | ... | ... | ... | ... | ... | ... | ... | ... | ... | ... | ... | ... | ... | ... | ... | ... | ... | ... | ... | ... | ... | ... | ... | ... | ... | ... | ... | ... | ... | ... | ... | ... | ... | ... | ... | ... | ... | ... | ... | ... | ... | ... | ... | ... | ... | ... |
| Order: 9, Pixel: 2197120 | ... | ... | ... | ... | ... | ... | ... | ... | ... | ... | ... | ... | ... | ... | ... | ... | ... | ... | ... | ... | ... | ... | ... | ... | ... | ... | ... | ... | ... | ... | ... | ... | ... | ... | ... | ... | ... | ... | ... | ... | ... | ... | ... | ... | ... | ... | ... | ... | ... | ... | ... | ... | ... | ... | ... | ... | ... | ... | ... | ... |
Notice that we instantiate a Dask Client to efficiently parallelize our computations:
[8]:
# Dask puts out more advisory logging than we care for in this tutorial.
# It takes some doing to quiet all of it, but this recipe works.

import dask

dask.config.set({"logging.distributed": "critical"})

import logging

# This also has to be done, for the above to be effective
logger = logging.getLogger("distributed")
logger.setLevel(logging.CRITICAL)

import warnings

# Finally, suppress the specific warning about Dask dashboard port usage
warnings.filterwarnings("ignore", message="Port 8787 is already in use.")
[9]:
with Client(n_workers=4, threads_per_worker=1) as client:
    # Sort light curves by variable object index for plotting purposes
    result_df = result.compute().sort_values("index_var_obj")
result_df
[9]:
| index_var_obj | ra_var_obj | dec_var_obj | period_var_obj | coord_dec_obj | coord_decErr_obj | coord_ra_obj | coord_raErr_obj | g_psfFlux_obj | g_psfFluxErr_obj | g_psfMag_obj | g_psfMagErr_obj | i_psfFlux_obj | i_psfFluxErr_obj | i_psfMag_obj | i_psfMagErr_obj | objectId_obj | patch_obj | r_psfFlux_obj | r_psfFluxErr_obj | r_psfMag_obj | r_psfMagErr_obj | refBand_obj | refFwhm_obj | shape_flag_obj | shape_xx_obj | shape_xy_obj | shape_yy_obj | tract_obj | u_psfFlux_obj | u_psfFluxErr_obj | u_psfMag_obj | u_psfMagErr_obj | x_obj | xErr_obj | y_obj | y_psfFlux_obj | y_psfFluxErr_obj | y_psfMag_obj | y_psfMagErr_obj | yErr_obj | z_psfFlux_obj | z_psfFluxErr_obj | z_psfMag_obj | z_psfMagErr_obj | objectForcedSource_obj | _dist_arcsec_obj | index_var_dia | ra_var_dia | dec_var_dia | period_var_dia | dec_dia | diaObjectId_dia | nDiaSources_dia | ra_dia | radecMjdTai_dia | tract_dia | diaObjectForcedSource_dia | diaSource_dia | _dist_arcsec_dia | ||||||||||||||||||||||||||||||||||||||||||||||
|---|---|---|---|---|---|---|---|---|---|---|---|---|---|---|---|---|---|---|---|---|---|---|---|---|---|---|---|---|---|---|---|---|---|---|---|---|---|---|---|---|---|---|---|---|---|---|---|---|---|---|---|---|---|---|---|---|---|---|---|---|---|---|---|---|---|---|---|---|---|---|---|---|---|---|---|---|---|---|---|---|---|---|---|---|---|---|---|---|---|---|---|---|---|---|---|---|---|---|---|---|---|---|---|---|---|
| 1456157018405184225 | 0 | 94.955460 | -24.739520 | 0.120950 | -24.739524 | 0.000000 | 94.955465 | 0.000000 | 96215.617188 | 40.481762 | 18.941887 | 0.000457 | 269817.406250 | 131.805710 | 17.822325 | 0.000530 | 614437746487865779 | 38 | 189773.562500 | 49.227470 | 18.204411 | 0.000282 | i | 0.765916 | False | 3.862049 | -0.125740 | 3.714630 | 5526 | 18858.382812 | 89.659355 | 20.711239 | 0.005162 | 26773.500219 | 0.001538 | 11474.773004 | 323206.218750 | 600.387939 | 17.626301 | 0.002017 | 0.001516 | 192855.625000 | 97.654503 | 18.186920 | 0.000550 |
|
0.020477 | 0 | 94.955460 | -24.739520 | 0.120950 | -24.739521 | 614437746487853390 | 201 | 94.955459 | 60656.341913 | 5526 |
|
|
0.006033 | |||||||||||||||||||||||||||||||||||||||||||||
| 1450131236226156835 | 1 | 95.302350 | -25.274310 | 0.122480 | -25.274306 | 0.000000 | 95.302354 | 0.000000 | 38424.933594 | 34.274925 | 19.938467 | 0.000968 | 117489.132812 | 143.596176 | 18.725006 | 0.001327 | 614435616184087063 | 7 | 80723.289062 | 45.217892 | 19.132504 | 0.000608 | i | 0.775459 | False | 3.619916 | -0.049815 | 3.491835 | 5526 | 7751.314941 | 183.145325 | 21.676561 | 0.025658 | 21076.081273 | 0.003834 | 1870.507517 | 153380.859375 | 948.672607 | 18.435572 | 0.006715 | 0.003639 | 109926.289062 | 130.206573 | 18.797247 | 0.001286 |
|
0.019504 | 1 | 95.302350 | -25.274310 | 0.122480 | -25.274309 | 614435616184074426 | 97 | 95.302351 | 60656.341097 | 5526 |
|
|
0.006324 | |||||||||||||||||||||||||||||||||||||||||||||
| 1456157750233453047 | 2 | 94.916260 | -24.696480 | 0.120380 | -24.696482 | 0.000000 | 94.916260 | 0.000000 | 333769.843750 | 75.333427 | 17.591383 | 0.000245 | 611969.625000 | 227.106125 | 16.933176 | 0.000403 | 614438502402106281 | 49 | 581614.875000 | 91.656525 | 16.988411 | 0.000171 | i | 0.718889 | False | 3.523738 | -0.119928 | 3.450615 | 5526 | 97035.140625 | 136.521637 | 18.932678 | 0.001528 | 27418.764816 | 0.001104 | 12246.102667 | 874192.437500 | 862.398376 | 16.545982 | 0.001071 | 0.001096 | 666255.562500 | 155.905563 | 16.840899 | 0.000254 |
|
0.008658 | 2 | 94.916260 | -24.696480 | 0.120380 | -24.696486 | 614438502402097162 | 191 | 94.916259 | 60656.341913 | 5526 |
|
|
0.023539 | |||||||||||||||||||||||||||||||||||||||||||||
| 1456145241786549427 | 3 | 95.124180 | -25.043290 | 0.235540 | -25.043288 | 0.000000 | 95.124185 | 0.000000 | 1447216.250000 | 131.617188 | 15.998667 | 0.000099 | 1512019.250000 | 277.406952 | 15.951107 | 0.000199 | 614436990573616692 | 27 | 1507937.250000 | 147.580673 | 15.954041 | 0.000106 | i | 0.781935 | False | 4.078254 | -0.103258 | 3.896416 | 5526 | 587695.562500 | 258.763855 | 16.977119 | 0.000478 | 23993.141039 | 0.000597 | 6019.453925 | 1376247.375000 | 874.364258 | 16.053259 | 0.000690 | 0.000565 | 1391431.750000 | 206.822601 | 16.041346 | 0.000161 |
|
0.017603 | 3 | 95.124180 | -25.043290 | 0.235540 | -25.043283 | 614436990573609020 | 190 | 95.124193 | 60656.341913 | 5526 |
|
|
0.048900 | |||||||||||||||||||||||||||||||||||||||||||||
| 2415759959093266587 | 4 | 58.835060 | -48.791220 | 0.563350 | -48.791216 | 0.000000 | 58.835057 | 0.000000 | 227908.046875 | 62.881378 | 18.005600 | 0.000300 | 298667.968750 | 97.474693 | 17.712029 | 0.000354 | 592913981740430064 | 26 | 284213.812500 | 63.170666 | 17.765886 | 0.000241 | i | 0.860226 | False | 4.747889 | -0.143074 | 4.982483 | 2394 | 137513.906250 | 495.075928 | 18.554134 | 0.003909 | 20136.685019 | 0.001144 | 6990.269591 | 317141.250000 | 348.949615 | 17.646868 | 0.001195 | 0.001196 | 334122.062500 | 127.251488 | 17.590237 | 0.000414 |
|
0.015211 | 4 | 58.835060 | -48.791220 | 0.563350 | -48.791213 | 592913981740417050 | 207 | 58.835037 | 60655.279809 | 2394 |
|
|
0.060615 | |||||||||||||||||||||||||||||||||||||||||||||
| 1456140633585049253 | 5 | 94.922640 | -25.231850 | 0.076720 | -25.231852 | 0.000000 | 94.922636 | 0.000000 | 114717.398438 | 40.412148 | 18.750927 | 0.000382 | 124674.359375 | 96.265068 | 18.660557 | 0.000838 | 614435753623041404 | 9 | 117883.578125 | 40.532890 | 18.721367 | 0.000373 | i | 0.781278 | False | 3.951747 | -0.079254 | 3.779037 | 5526 | 47365.300781 | 129.390182 | 19.711349 | 0.002966 | 27261.856164 | 0.002514 | 2608.901159 | 114787.703125 | 444.425446 | 18.750261 | 0.004204 | 0.002415 | 107830.750000 | 95.726501 | 18.818144 | 0.000964 |
|
0.014024 | 5 | 94.922640 | -25.231850 | 0.076720 | -25.231851 | 614435753623027782 | 186 | 94.922635 | 60656.341913 | 5526 |
|
|
0.015657 | |||||||||||||||||||||||||||||||||||||||||||||
| 1456149791804243835 | 6 | 94.720860 | -25.057670 | 0.175590 | -25.057669 | 0.000000 | 94.720857 | 0.000000 | 234904.062500 | 57.171268 | 17.972775 | 0.000264 | 340439.937500 | 150.168243 | 17.569899 | 0.000479 | 614429019114322311 | 11 | 307911.031250 | 67.220116 | 17.678936 | 0.000237 | i | 0.807315 | False | 4.236218 | -0.149095 | 4.131883 | 5525 | 112731.046875 | 152.079132 | 18.769892 | 0.001465 | 4125.398950 | 0.001465 | 5752.096897 | 378513.843750 | 581.769897 | 17.454796 | 0.001669 | 0.001442 | 307040.531250 | 120.279778 | 17.682011 | 0.000425 |
|
0.010659 | 6 | 94.720860 | -25.057670 | 0.175590 | -25.057664 | 614429019114307699 | 180 | 94.720857 | 60656.341097 | 5525 |
|
|
0.024753 | |||||||||||||||||||||||||||||||||||||||||||||
| 2415669000192289034 | 8 | 59.129970 | -48.785220 | 0.116280 | -48.785224 | 0.000000 | 59.129967 | 0.000000 | 15816.786133 | 24.092821 | 20.902205 | 0.001654 | 41957.535156 | 51.133236 | 19.842976 | 0.001323 | 592913913020955088 | 25 | 30814.417969 | 26.435709 | 20.178116 | 0.000931 | i | 0.855076 | False | 4.690122 | -0.119492 | 4.728663 | 2394 | 3558.745361 | 227.412216 | 22.521757 | 0.069476 | 16639.578774 | 0.004362 | 7111.261595 | 52567.726562 | 284.252258 | 19.598202 | 0.005871 | 0.004407 | 44020.945312 | 86.908951 | 19.790852 | 0.002144 |
|
0.015603 | 8 | 59.129970 | -48.785220 | 0.116280 | -48.785226 | 592913913020940296 | 152 | 59.129967 | 60655.279414 | 2394 |
|
|
0.023348 | |||||||||||||||||||||||||||||||||||||||||||||
| 1456149791804243835 | 9 | 94.720860 | -25.057670 | 0.175540 | -25.057669 | 0.000000 | 94.720857 | 0.000000 | 234904.062500 | 57.171268 | 17.972775 | 0.000264 | 340439.937500 | 150.168243 | 17.569899 | 0.000479 | 614429019114322311 | 11 | 307911.031250 | 67.220116 | 17.678936 | 0.000237 | i | 0.807315 | False | 4.236218 | -0.149095 | 4.131883 | 5525 | 112731.046875 | 152.079132 | 18.769892 | 0.001465 | 4125.398950 | 0.001465 | 5752.096897 | 378513.843750 | 581.769897 | 17.454796 | 0.001669 | 0.001442 | 307040.531250 | 120.279778 | 17.682011 | 0.000425 |
|
0.010659 | 9 | 94.720860 | -25.057670 | 0.175540 | -25.057664 | 614429019114307699 | 180 | 94.720857 | 60656.341097 | 5525 |
|
|
0.024753 |
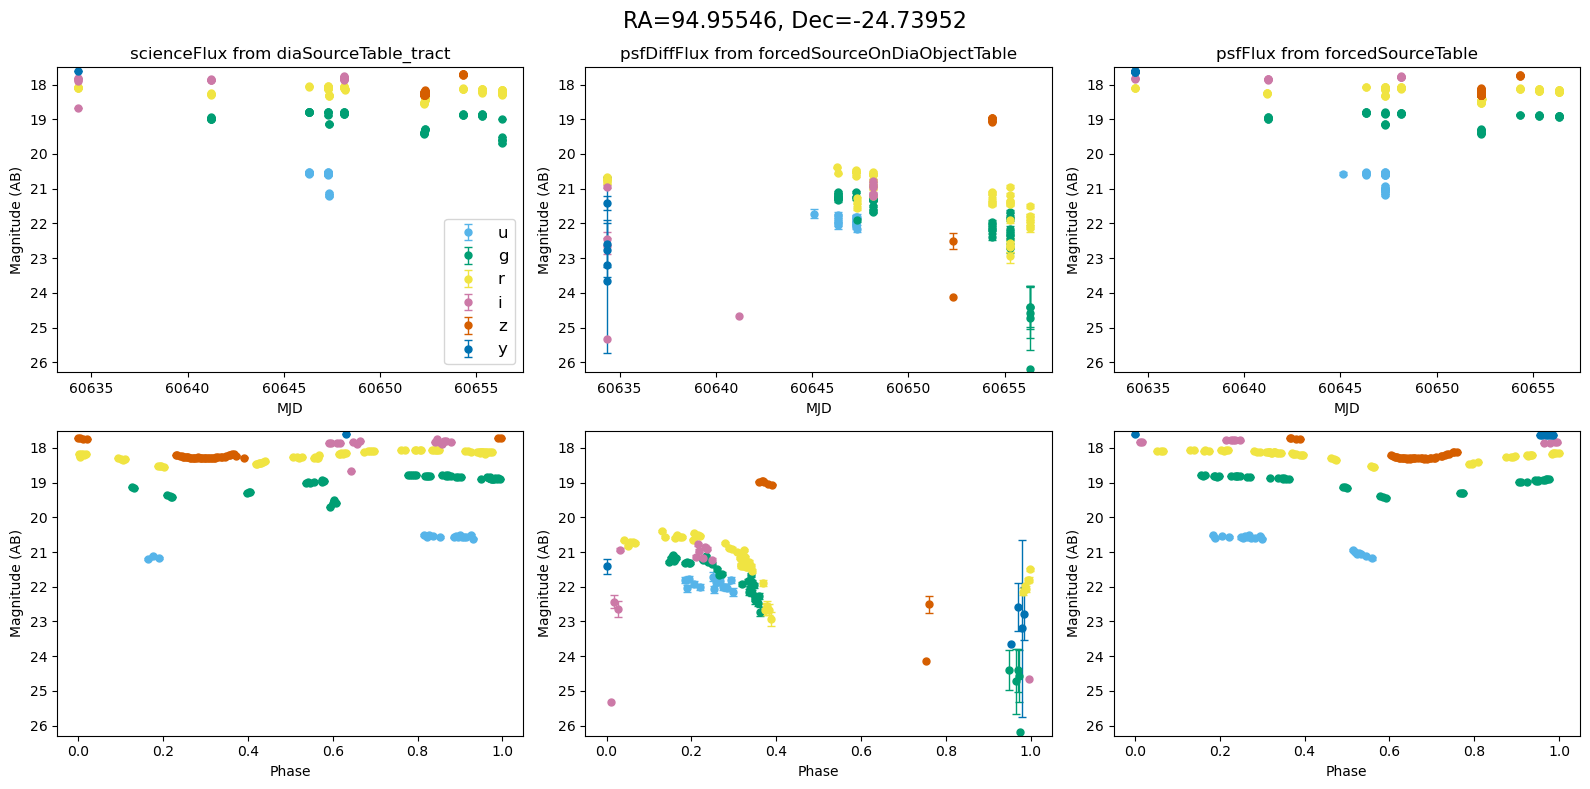
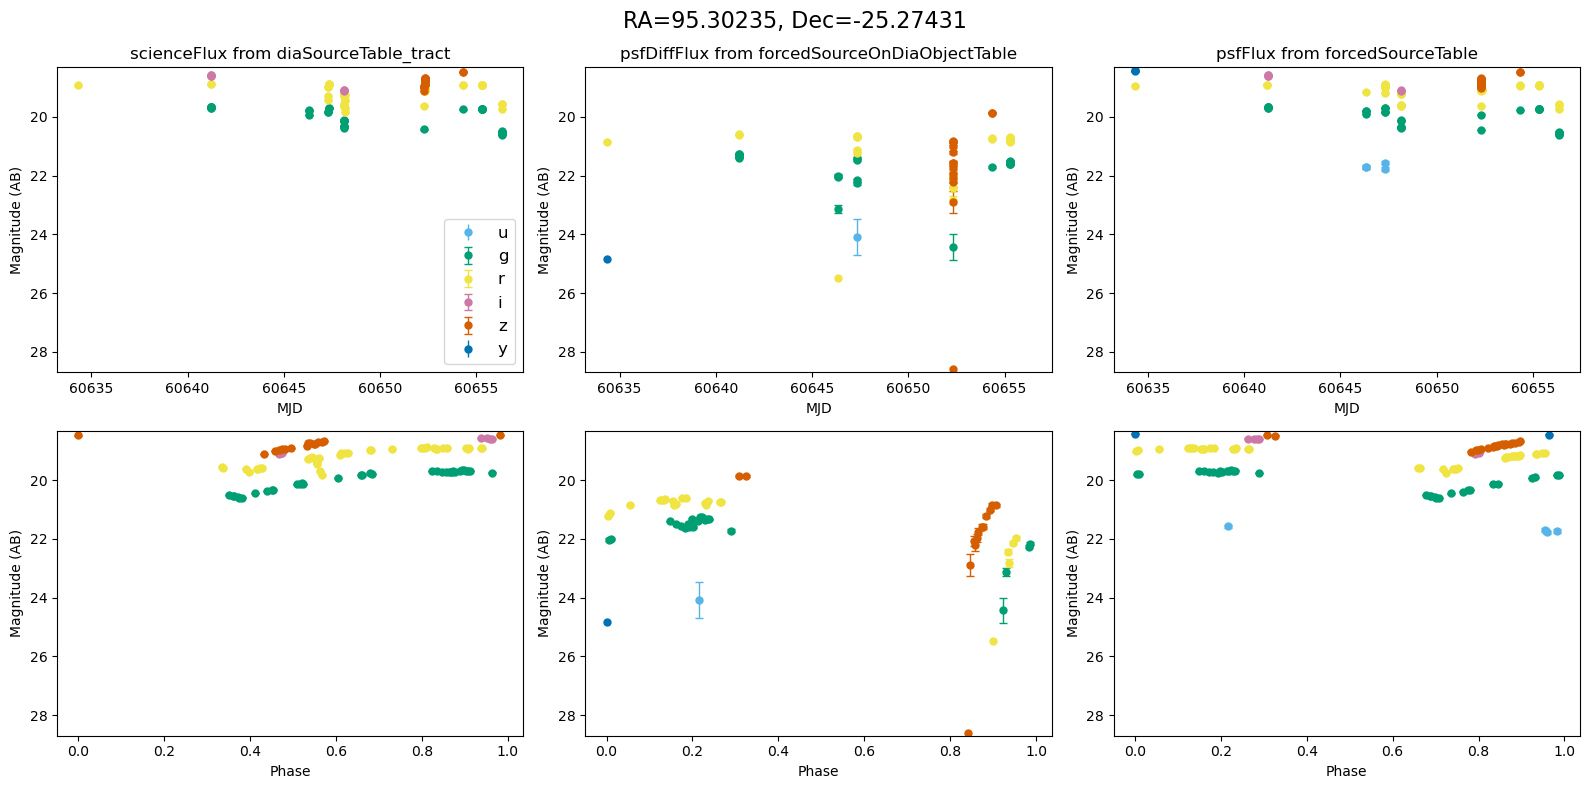
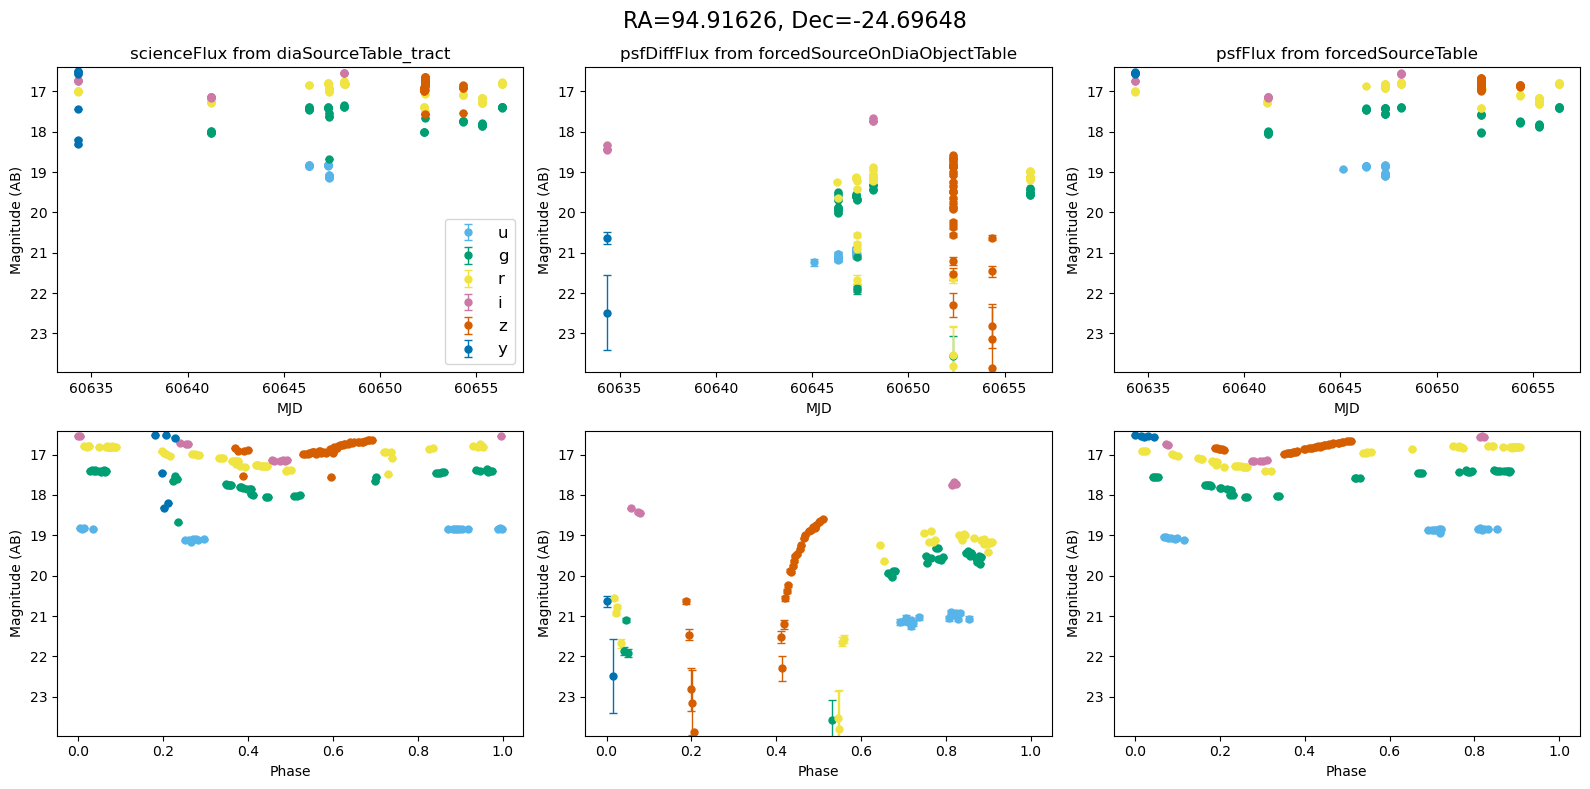
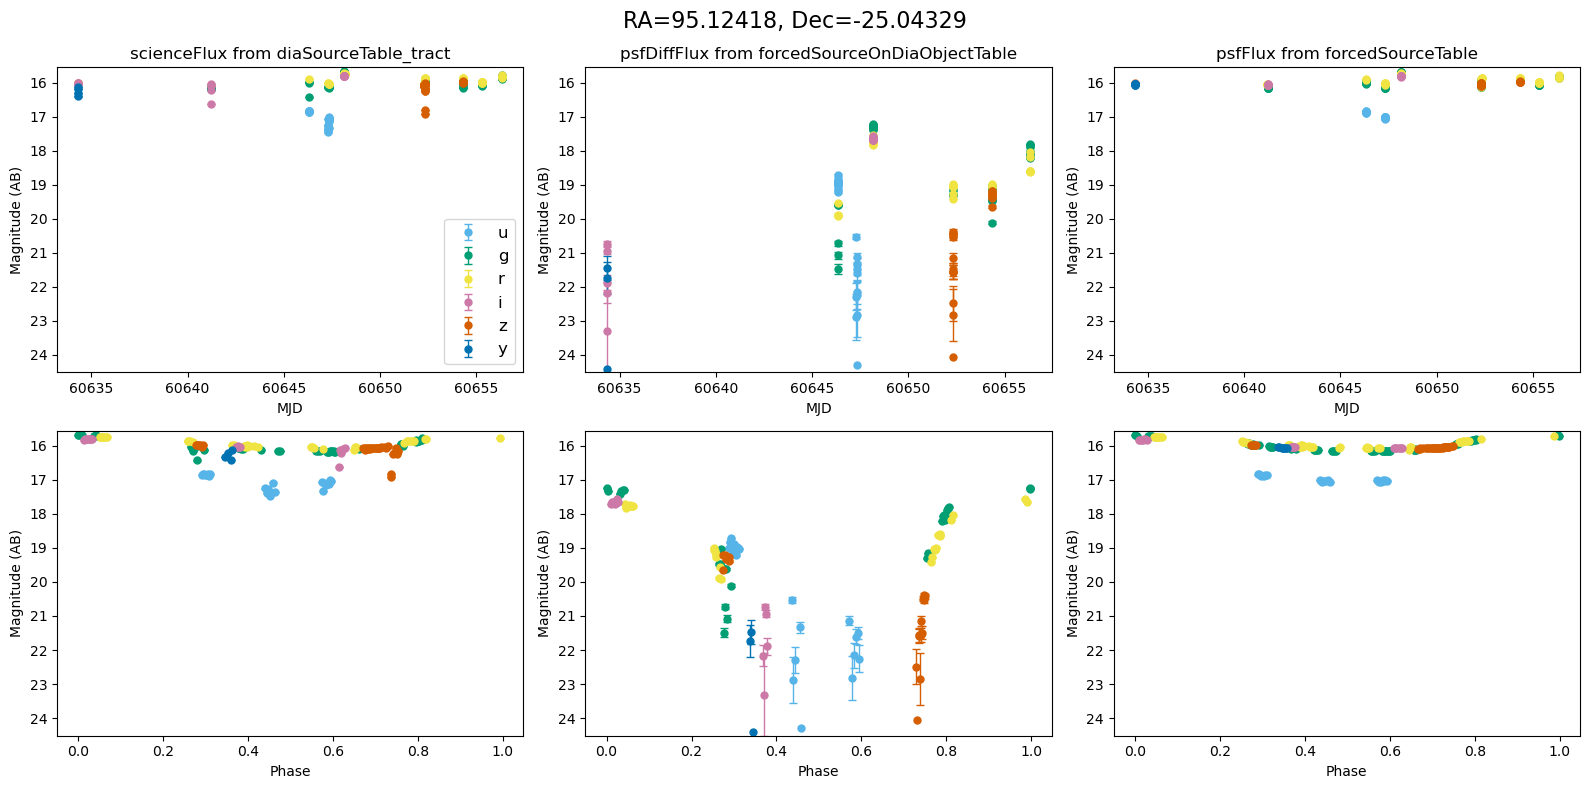
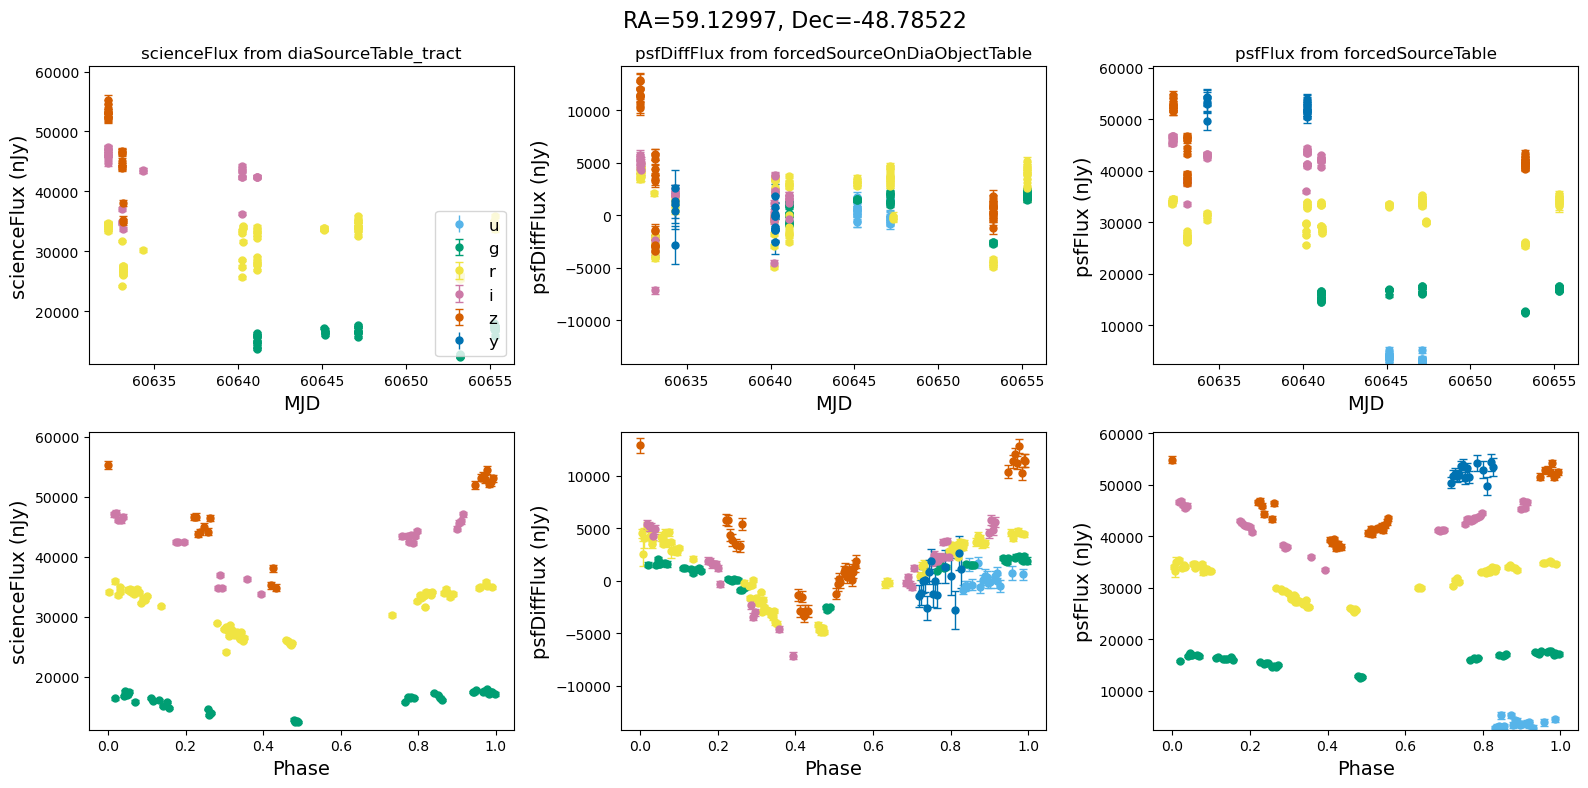
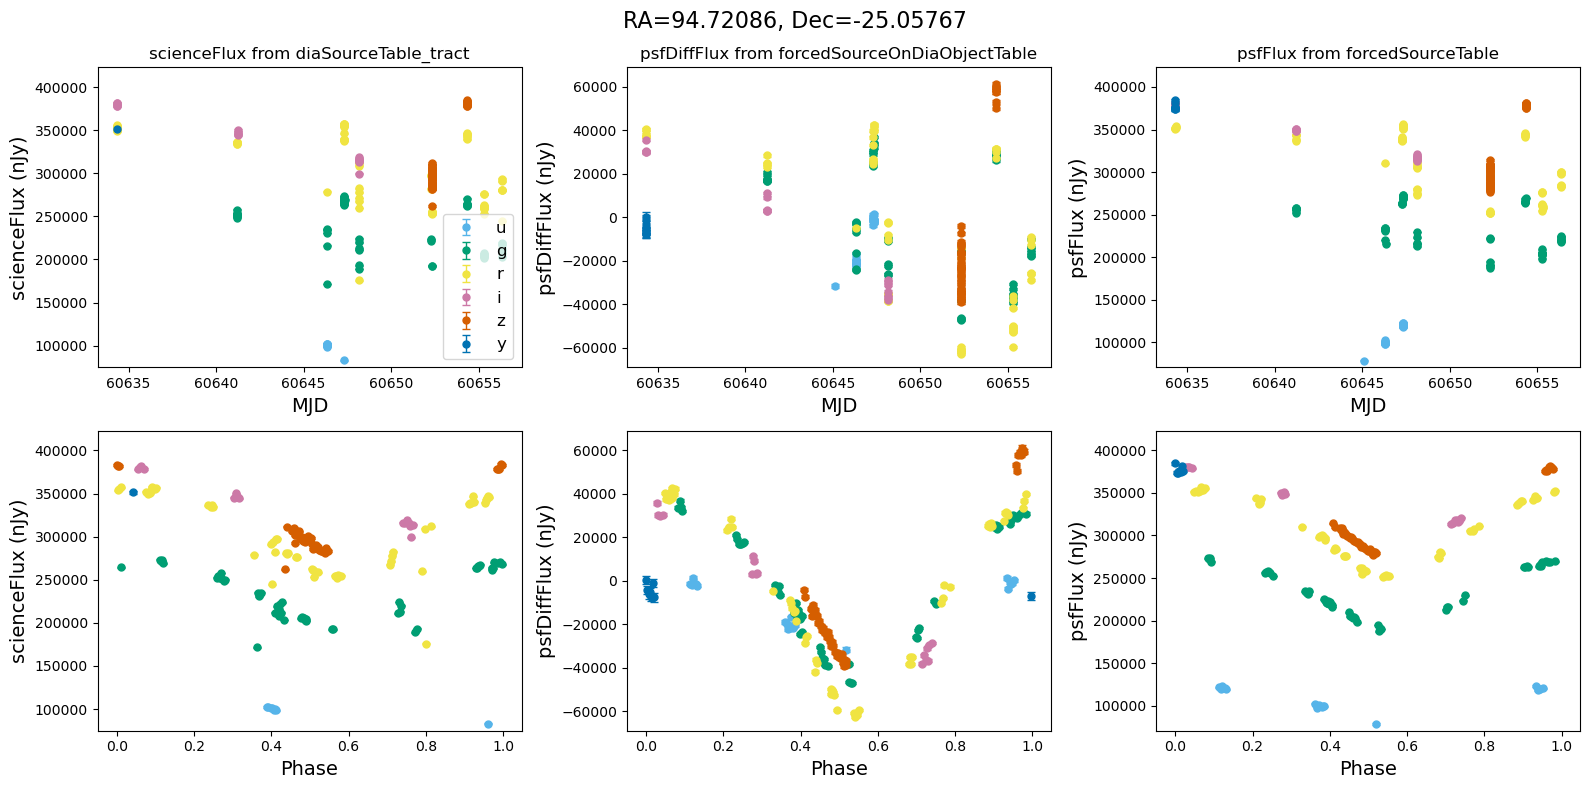
Plot the lightcurves from the Rubin Data#
The following utility methods allow us to plot light curves from DIA source, DIA forced source and forcedSource, for each of our matches.
[10]:
COLORS = {
    "u": "#56b4e9",
    "g": "#009e73",
    "r": "#f0e442",
    "i": "#cc79a7",
    "z": "#d55e00",
    "y": "#0072b2",
}
In the magnitude scale#
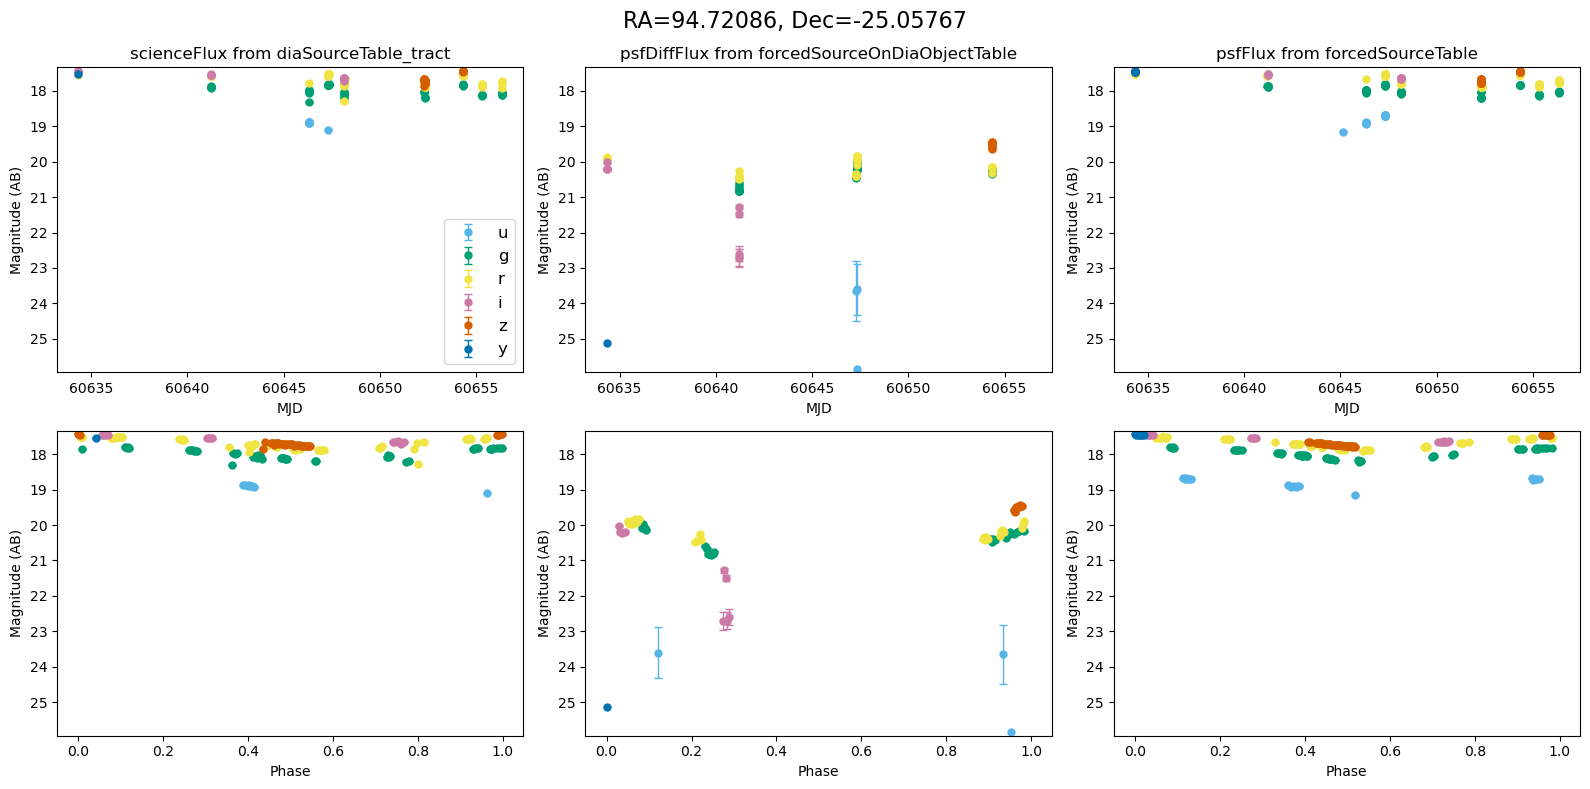
[11]:
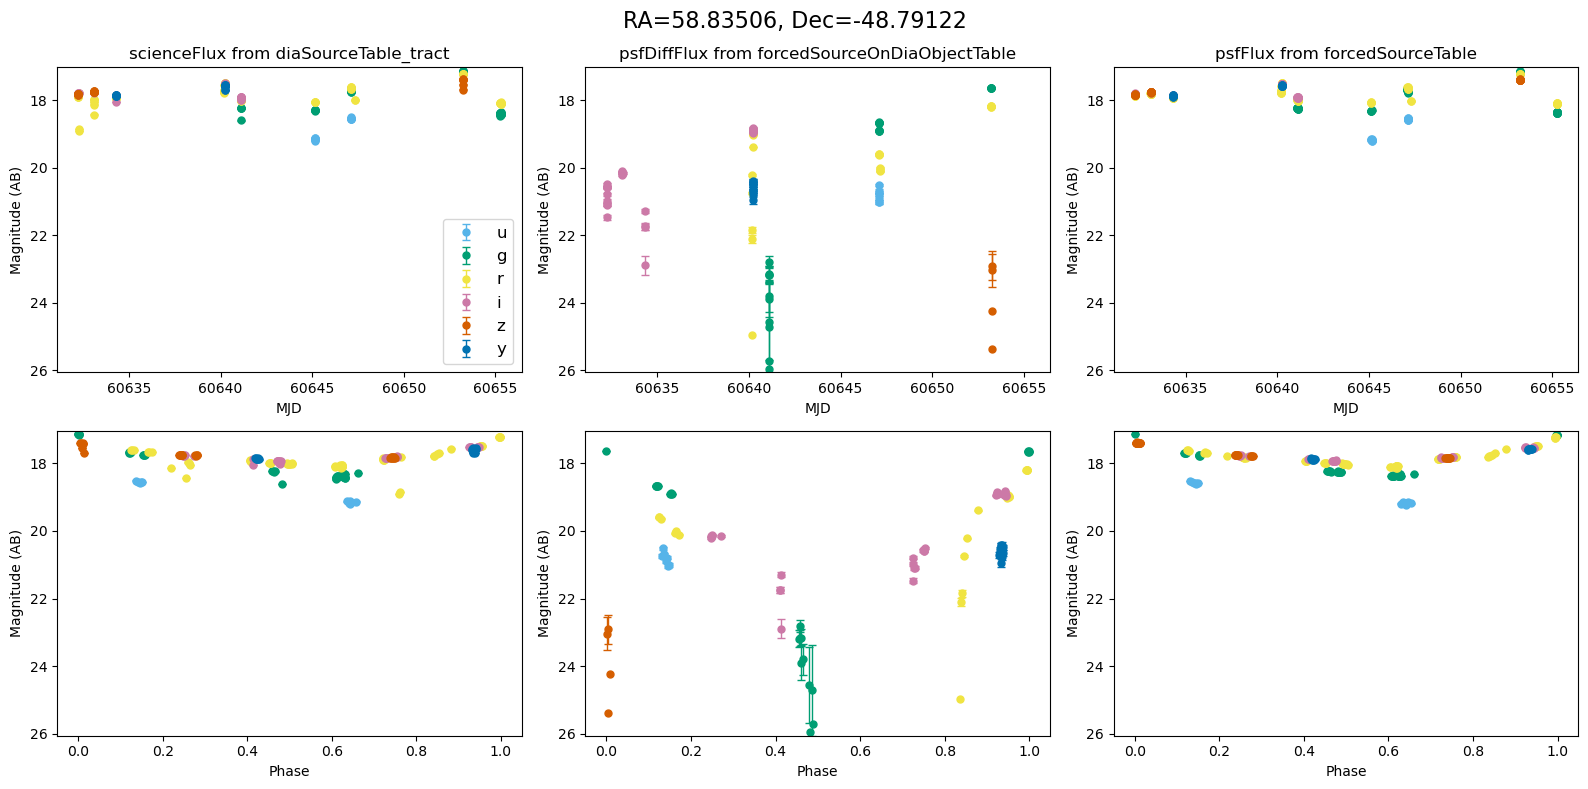
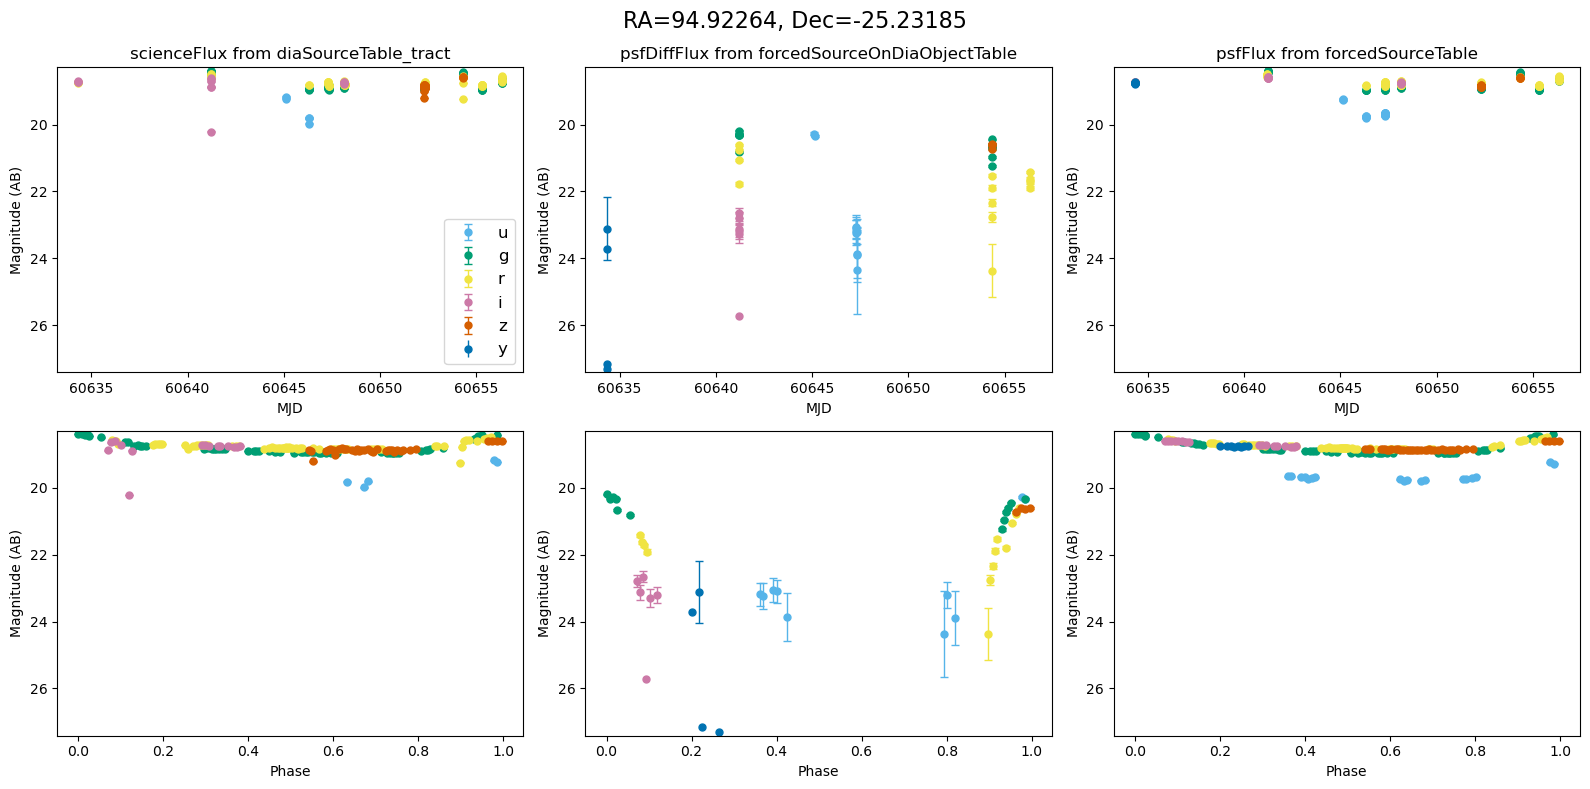
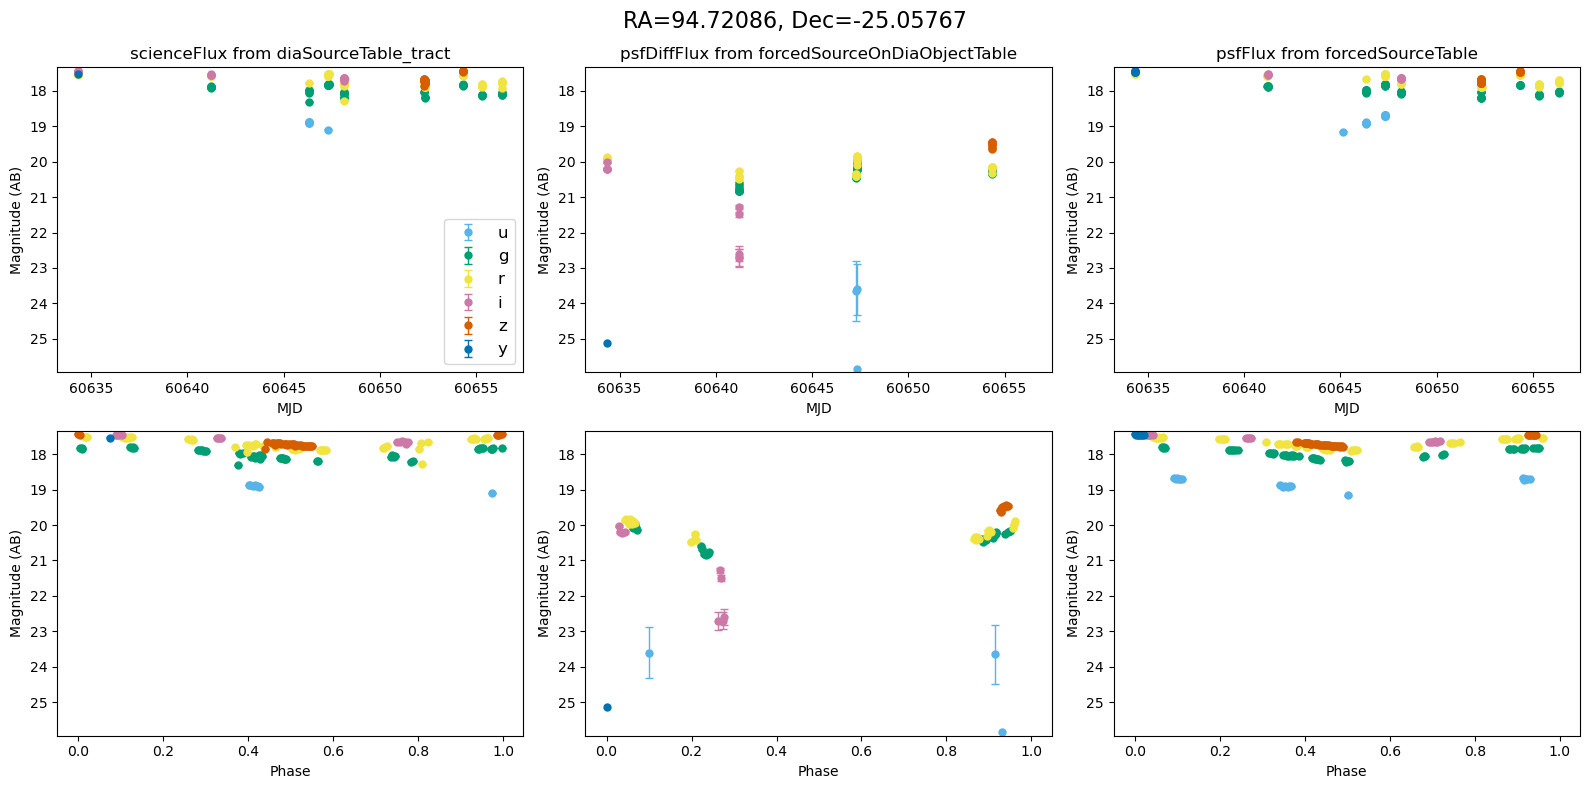
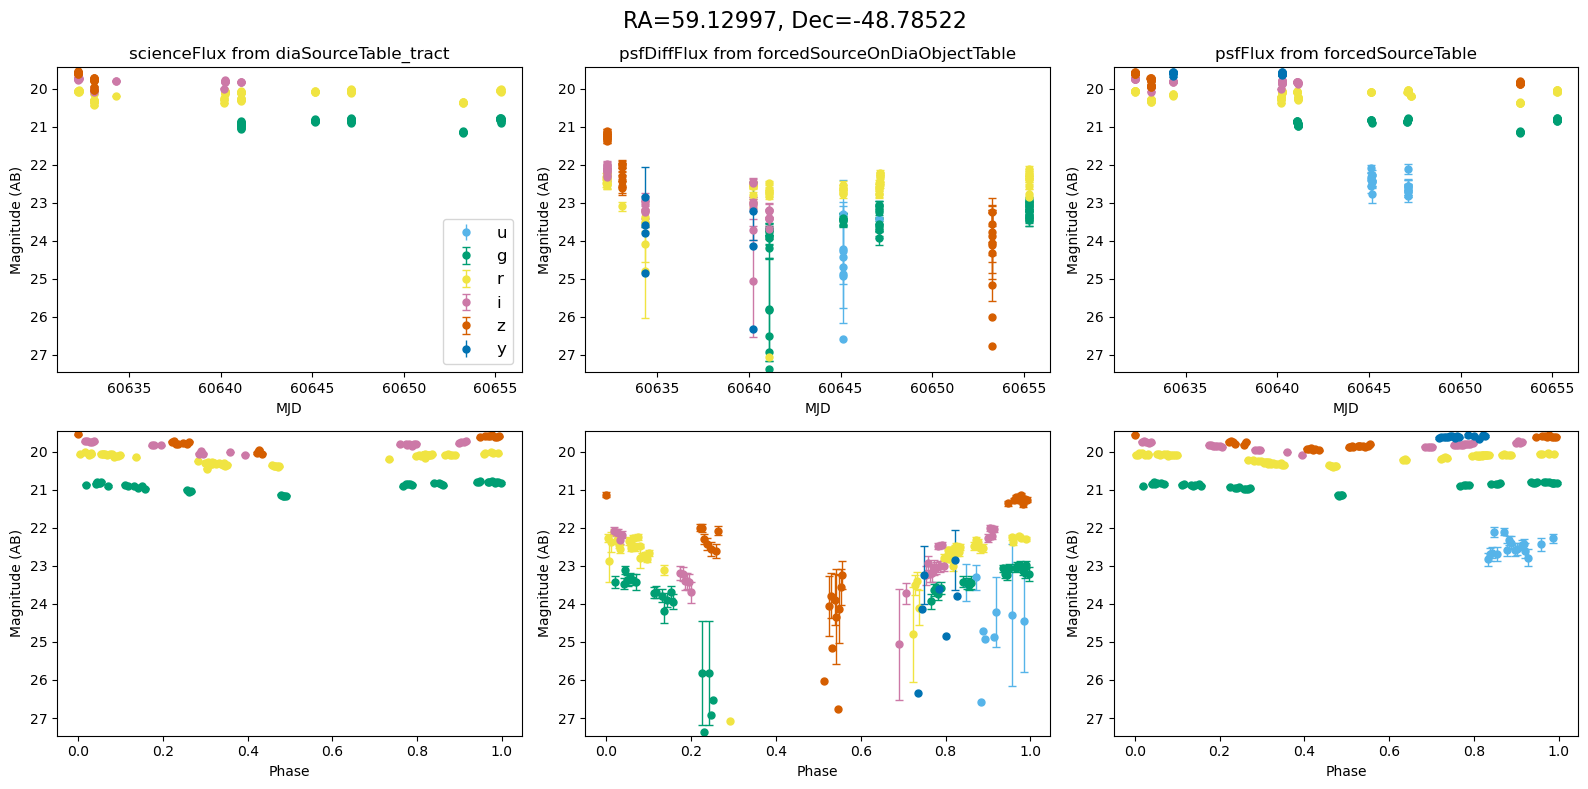
def plot_mag_lightcurves(ax, row):
    """Plot magnitude light curves from DIA source, DIA forced source and forcedSource"""
    # Define flux types for each dataset
    datasets = [
        ("scienceFlux", "diaSourceTable_tract", row.diaSource_dia),
        ("psfDiffFlux", "forcedSourceOnDiaObjectTable", row.diaObjectForcedSource_dia),
        ("psfFlux", "forcedSourceTable", row.objectForcedSource_obj),
    ]
    all_mags = [[], []]  # To store magnitudes for each row
    for i, (flux_col, table_name, lc) in enumerate(datasets):
        title = f"{flux_col} from {table_name}"
        flux_err_col = f"{flux_col}Err"
        ax[0, i].set_title(title)
        # Compute phase
        lc = lc.assign(
            phase=(lc.midpointMjdTai - lc.midpointMjdTai.loc[lc.psfFlux.idxmax()])
            % row.period_var_obj
            / row.period_var_obj
        )
        # First row: original light curve
        all_mags[0].extend(
            plot_mag_scale(
                ax[0, i],
                lc,
                flux_col,
                flux_err_col,
                x_name="midpointMjdTai",
                x_label="MJD",
                show_legend=(i == 0),
            )
        )
        # Second row: folded light curve
        all_mags[1].extend(
            plot_mag_scale(ax[1, i], lc, flux_col, flux_err_col, x_name="phase", x_label="Phase")
        )
    return all_mags


def plot_mag_scale(ax, lc, flux_col, flux_err_col, x_name, x_label, show_legend=False):
    """Plot light curves in magnitude scale"""
    mag_values = []  # Store magnitudes for setting axis limits
    for band, color in COLORS.items():
        band_lc = lc.query(f"band == '{band}'")
        # Compute magnitudes and errors
        mag, magErr = create_mag_errors(band_lc[flux_col], band_lc[flux_err_col])
        ax.errorbar(
            band_lc[x_name],
            mag,
            magErr,
            fmt="o",
            label=band,
            color=color,
            alpha=1,
            markersize=5,
            capsize=3,
            elinewidth=1,
        )
        mag_values.extend(mag.dropna().values)  # Collect magnitude values
    ax.set_xlabel(x_label)
    ax.set_ylabel("Magnitude (AB)")
    ax.invert_yaxis()  # Magnitudes are plotted with brighter objects lower
    if show_legend:
        ax.legend(loc="lower right", fontsize=12)  # Show legend in top-left panel only
    return mag_values  # Return magnitudes for axis scaling


def create_mag_errors(sciFlux, sciFluxErr):
    """Move flux into magnitudes and calculate the error on the magnitude"""
    mag = u.nJy.to(u.ABmag, sciFlux)
    upper_mag = u.nJy.to(u.ABmag, sciFlux + sciFluxErr)
    lower_mag = u.nJy.to(u.ABmag, sciFlux - sciFluxErr)
    magErr = -(upper_mag - lower_mag) / 2
    return mag, magErr


def scale_mag_y_axis(ax, all_mags):
    """Set uniform y-axis scaling for each plot row"""
    for row_idx in range(2):
        if all_mags[row_idx]:  # Ensure we have data
            ymin, ymax = np.nanmin(all_mags[row_idx]), np.nanmax(all_mags[row_idx])
            for i in range(3):  # Apply limits to all columns in the row
                ax[row_idx, i].set_ylim(ymax + 0.1, ymin - 0.1)  # Keep magnitude inverted
[12]:
for _, row in result_df.iterrows():
    fig, ax = plt.subplots(2, 3, figsize=(16, 8), sharex="row")  # 2 rows, 3 columns
    fig.suptitle(
        f"RA={row.ra_var_obj:.5f}, Dec={row.dec_var_obj:.5f}",
        fontsize=16,
    )
    all_mags = plot_mag_lightcurves(ax, row)
    scale_mag_y_axis(ax, all_mags)
    plt.tight_layout()
    plt.show()
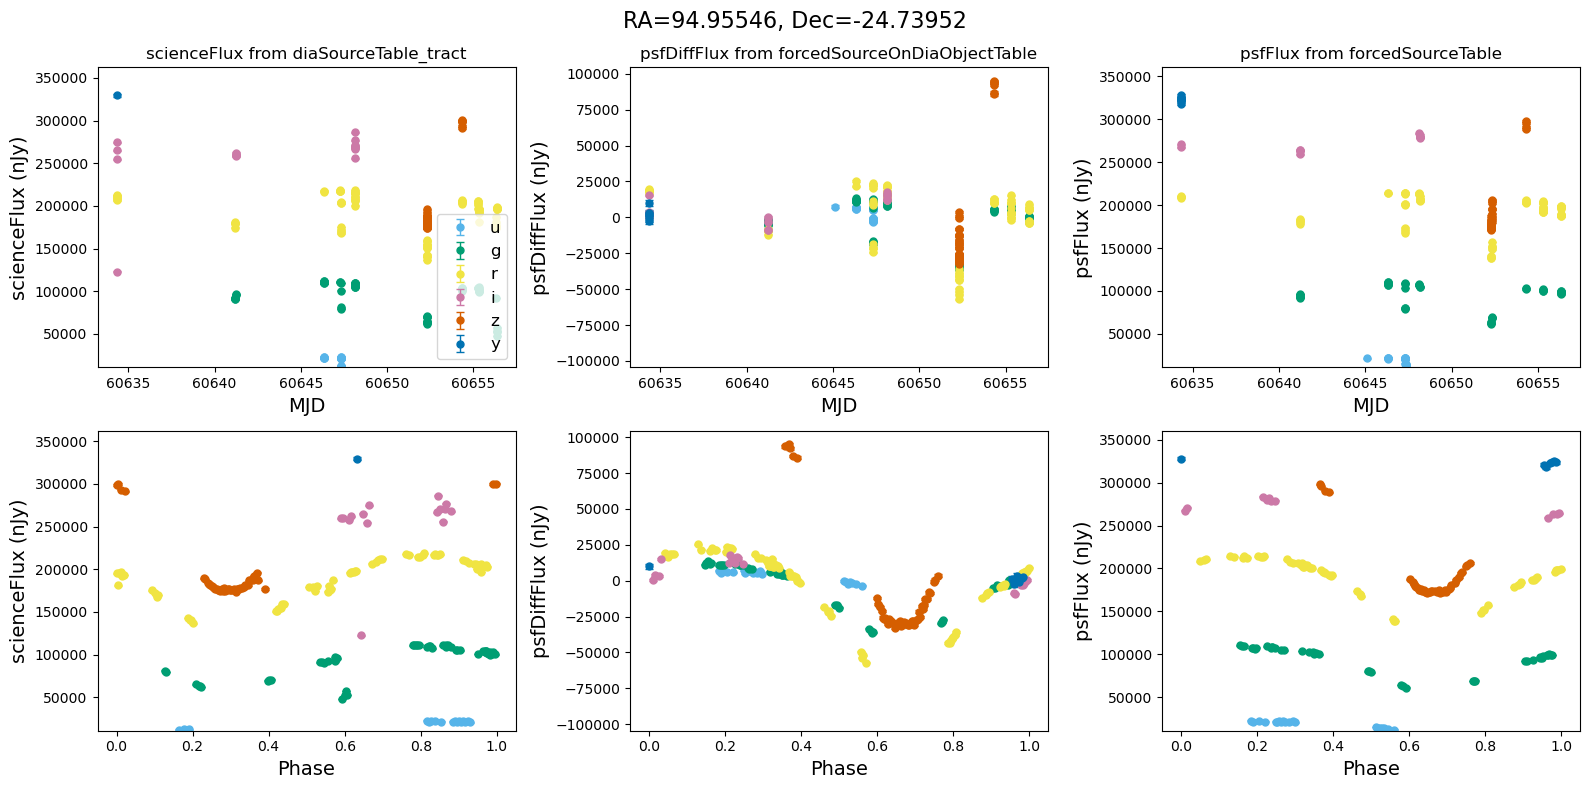
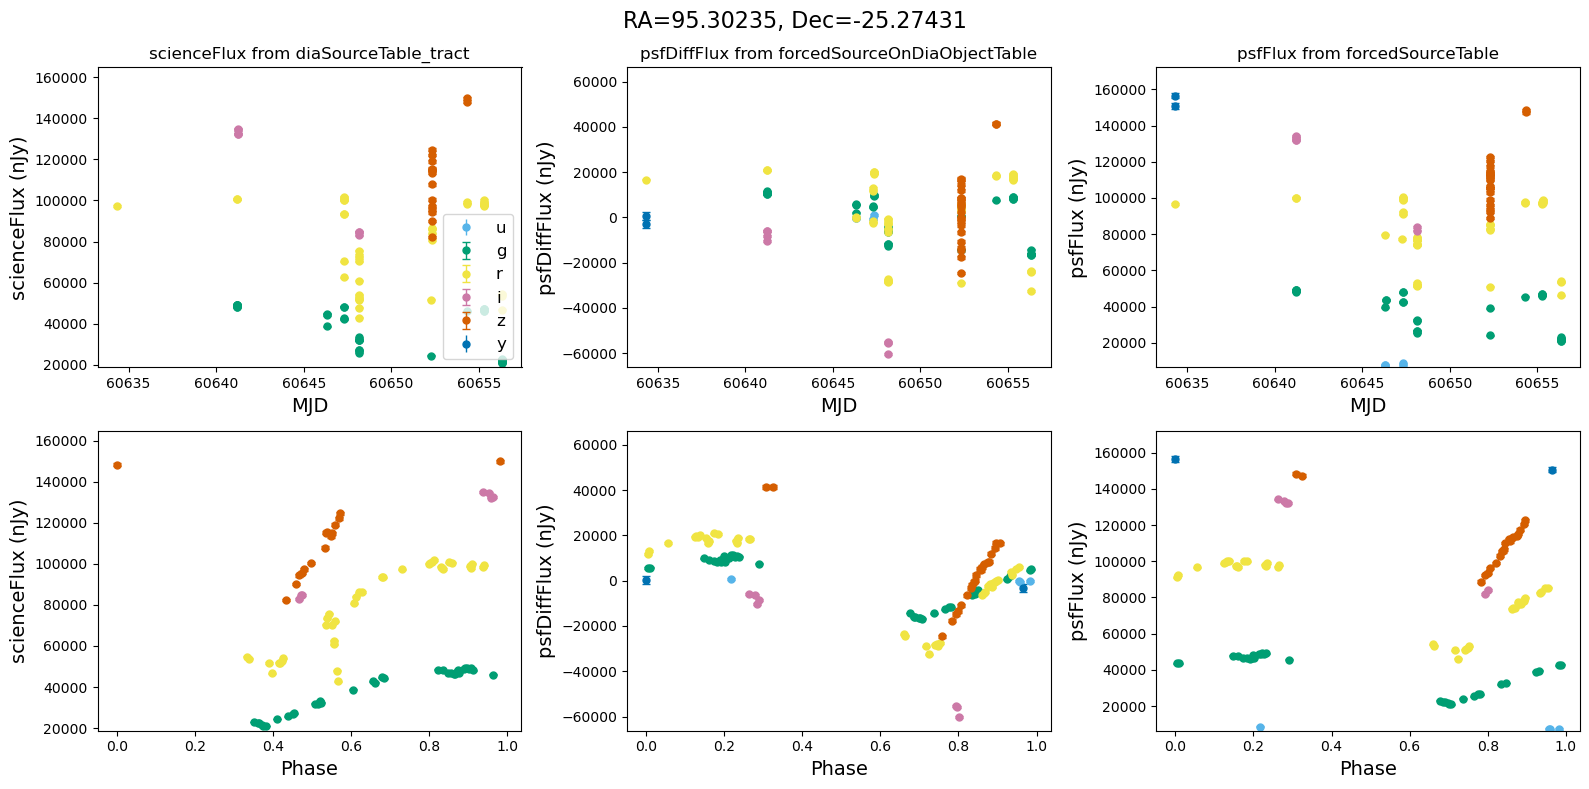
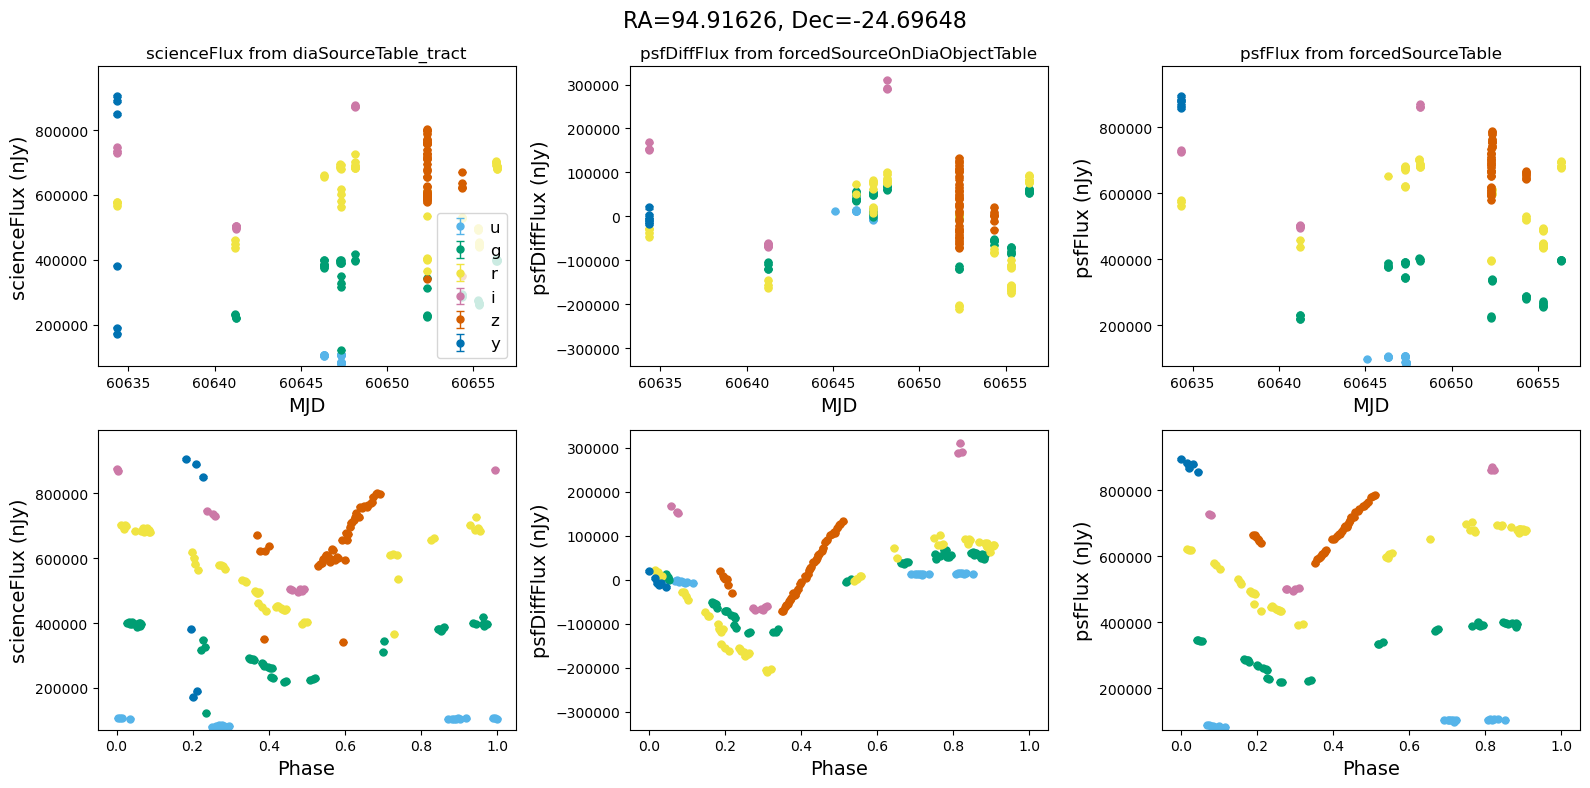
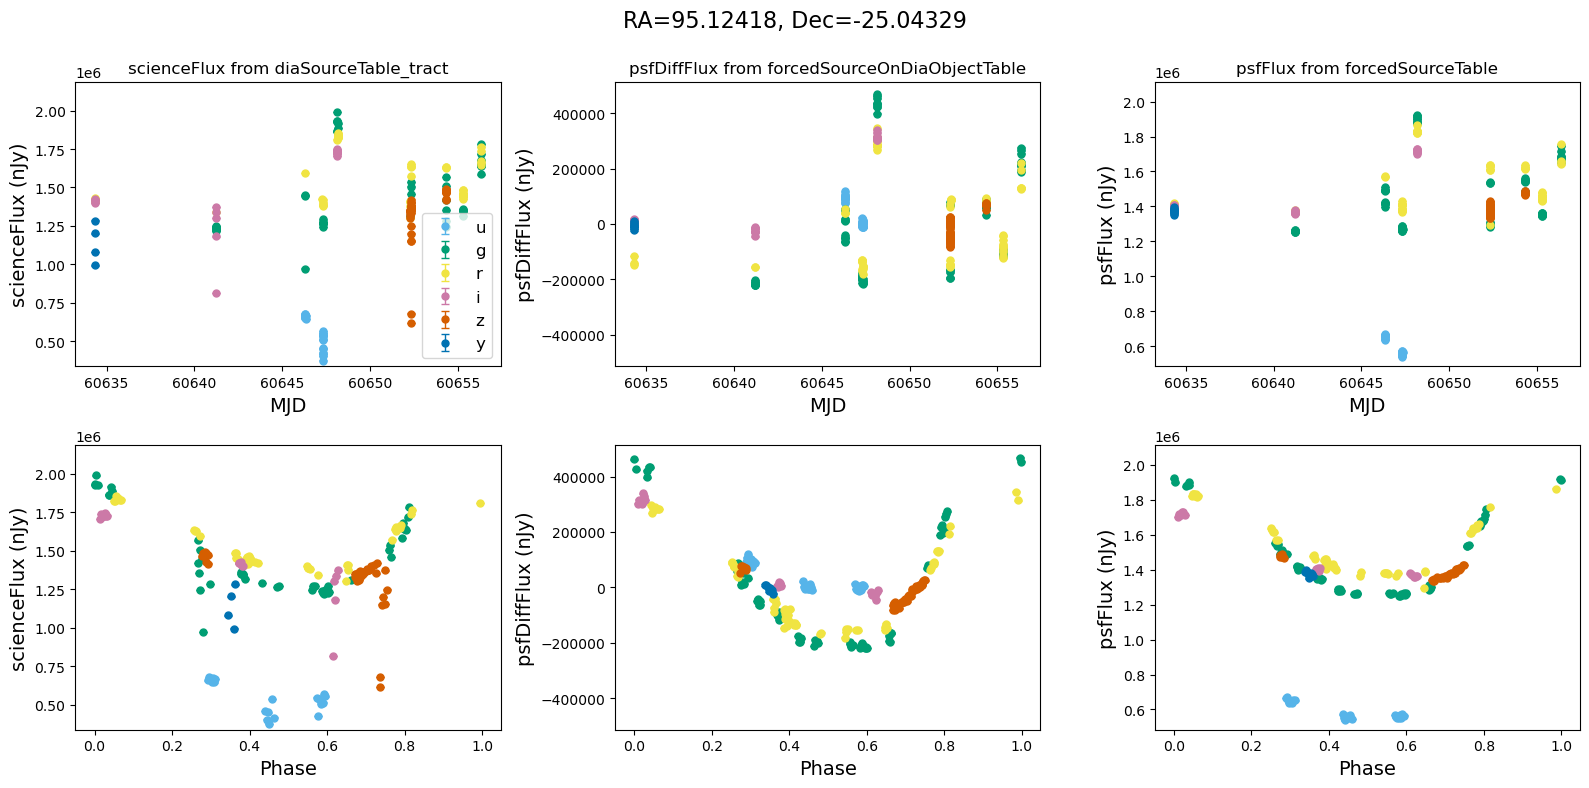
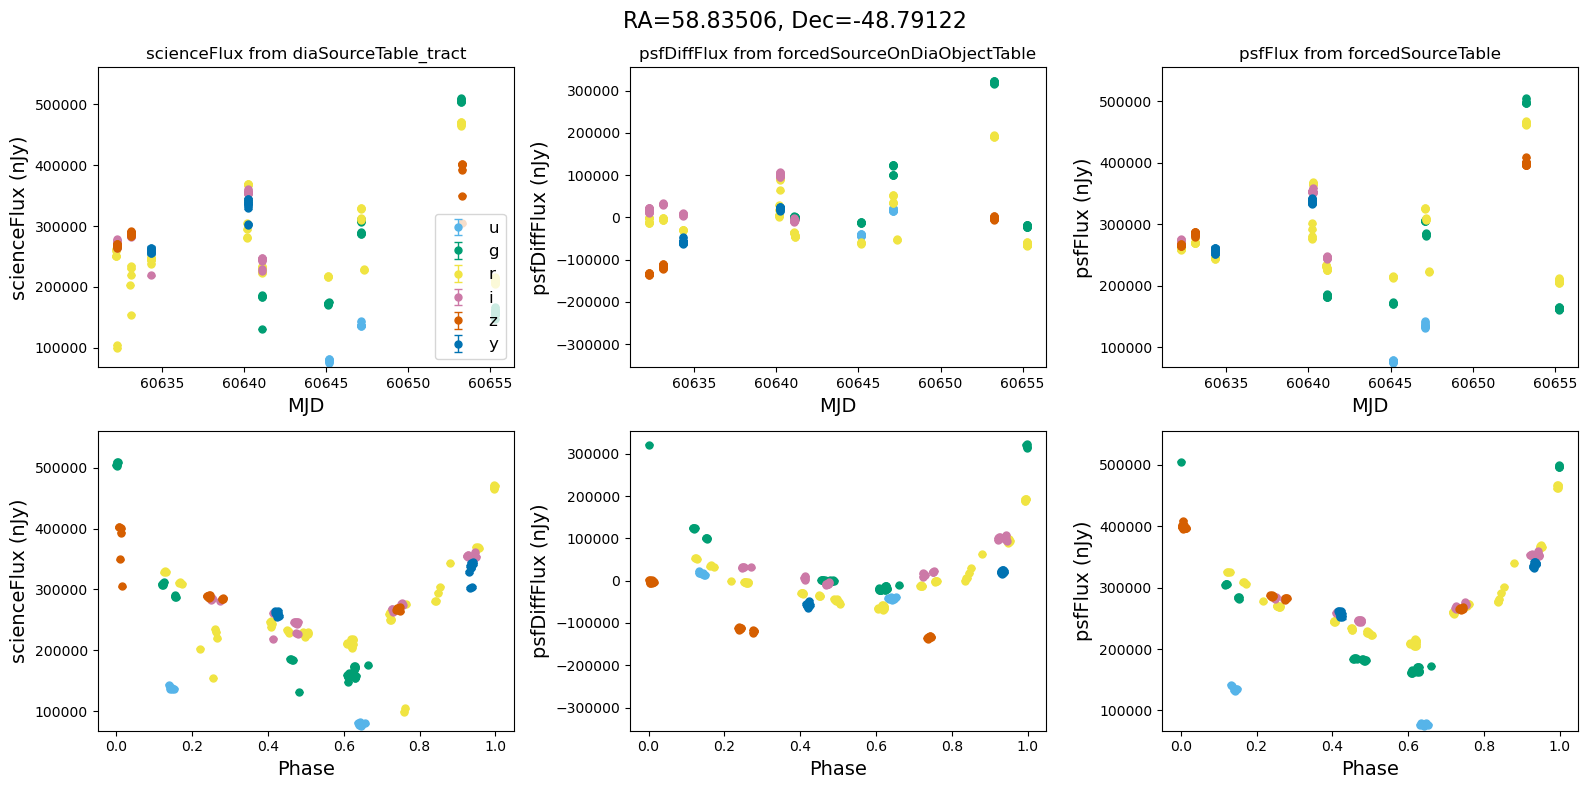
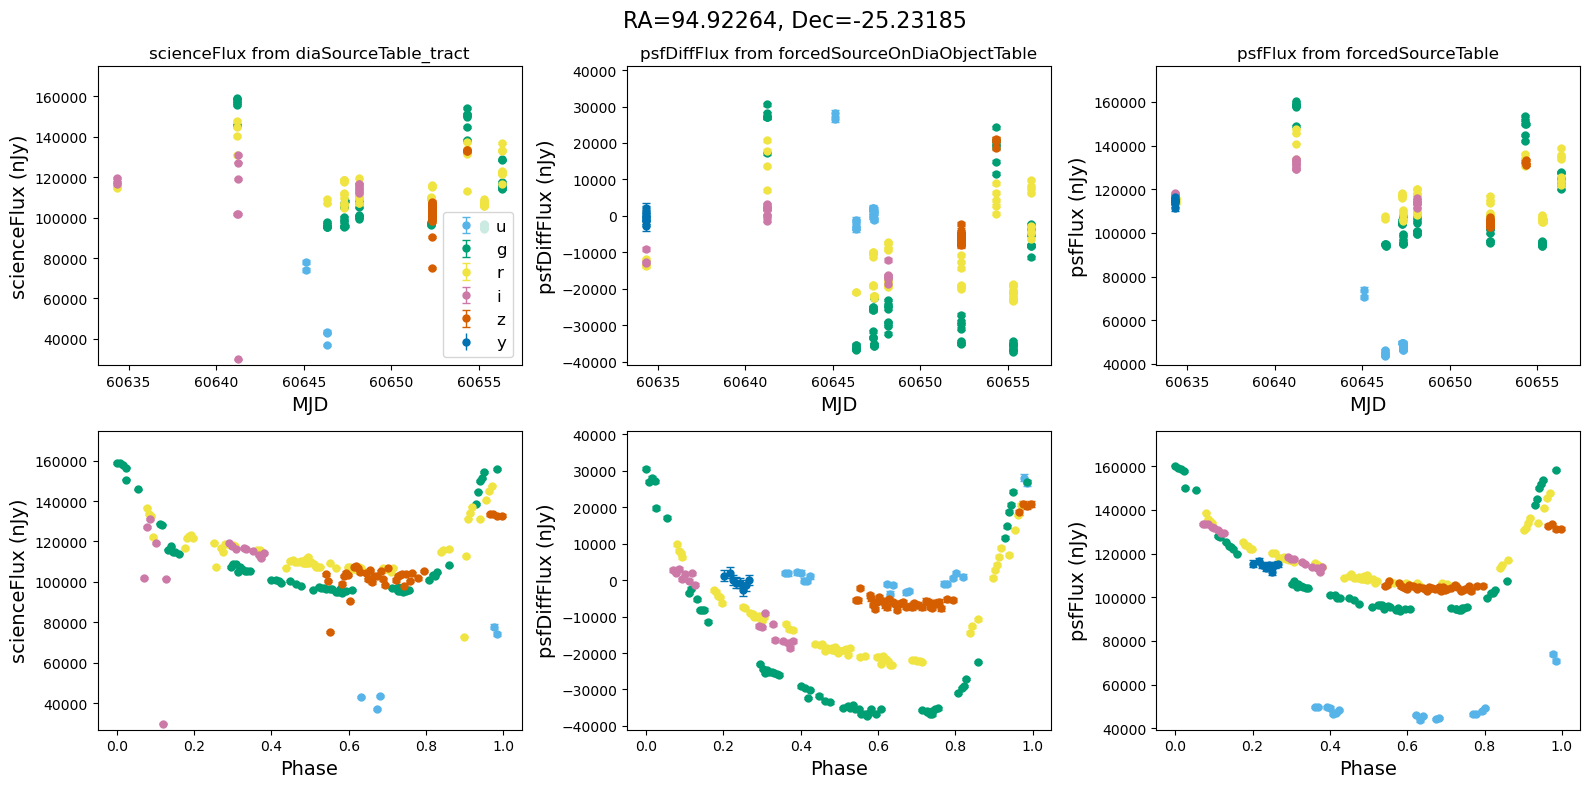
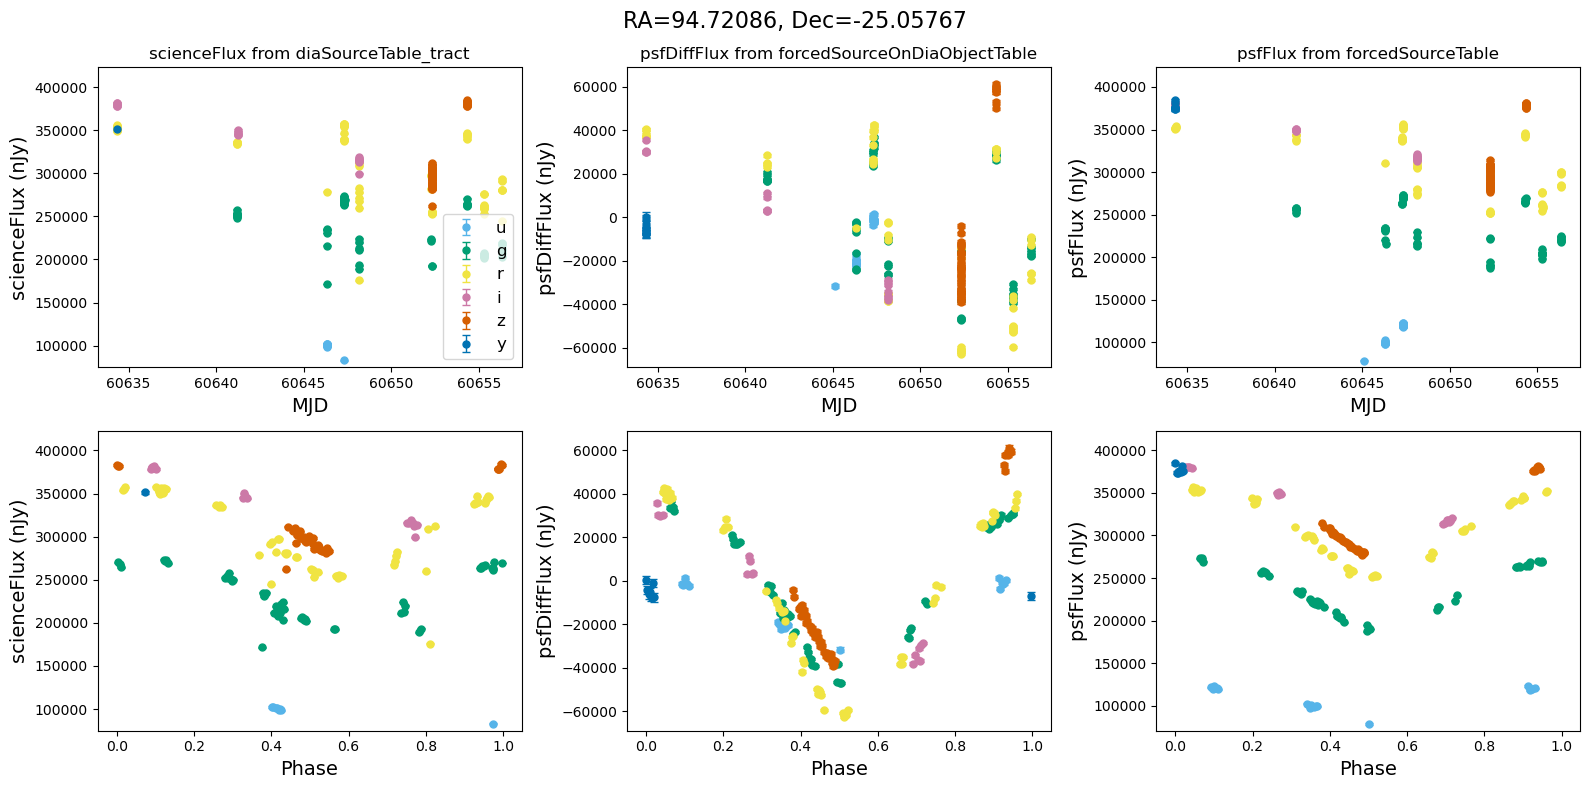
In the flux scale#
[13]:
def plot_flux_lightcurves(ax, row):
    """Plot flux light curves from DIA source, DIA forced source and forcedSource"""
    # Define flux types for each dataset
    datasets = [
        ("scienceFlux", "diaSourceTable_tract", row.diaSource_dia),
        ("psfDiffFlux", "forcedSourceOnDiaObjectTable", row.diaObjectForcedSource_dia),
        ("psfFlux", "forcedSourceTable", row.objectForcedSource_obj),
    ]
    all_flux = [[], [], []]  # To store flux for each row
    for i, (flux_col, table_name, lc) in enumerate(datasets):
        title = f"{flux_col} from {table_name}"
        flux_err_col = f"{flux_col}Err"
        ax[0, i].set_title(title)
        # Compute phase
        lc = lc.assign(
            phase=(lc.midpointMjdTai - lc.midpointMjdTai.loc[lc.psfFlux.idxmax()])
            % row.period_var_obj
            / row.period_var_obj
        )
        # First row: original light curve
        all_flux[i].extend(
            plot_flux_scale(
                ax[0, i],
                lc,
                flux_col,
                flux_err_col,
                x_name="midpointMjdTai",
                x_label="MJD",
                show_legend=(i == 0),
            )
        )
        # Second row: folded light curve
        all_flux[i].extend(
            plot_flux_scale(ax[1, i], lc, flux_col, flux_err_col, x_name="phase", x_label="Phase")
        )
    return all_flux


def plot_flux_scale(ax, lc, flux_col, flux_err_col, x_name, x_label, show_legend=False):
    """Function to plot light curves in flux scale"""
    flux_values = []  # Store flux values for setting axis limits
    for band, color in COLORS.items():
        band_lc = lc.query(f"band == '{band}'")
        # Extract flux values and errors directly
        flux = band_lc[flux_col]
        flux_err = band_lc[flux_err_col]
        ax.errorbar(
            band_lc[x_name],
            flux,
            flux_err,
            fmt="o",
            label=band,
            color=color,
            alpha=1,
            markersize=5,
            capsize=3,
            elinewidth=1,
        )
        flux_values.extend(flux.dropna().values)  # Collect flux values
    ax.set_xlabel(x_label, fontsize=14)  # Increased font size
    ax.set_ylabel(f"{flux_col} (nJy)", fontsize=14)  # Increased font size
    if show_legend:
        ax.legend(loc="lower right", fontsize=12)  # Show legend in top-left panel only
    return flux_values  # Return flux values for axis scaling


def scale_flux_y_axis(ax, all_flux):
    """Set uniform y-axis scaling for first and third columns, while middle remains independent and symmetric"""
    for row_idx in range(2):
        for col_idx in [0, 2]:  # Apply shared limits to first and third columns
            if all_flux[col_idx]:  # Ensure we have data
                ymin, ymax = np.nanmin(all_flux[col_idx]), np.nanmax(all_flux[col_idx])
                ax[row_idx, col_idx].set_ylim(ymin - 0.1 * abs(ymin), ymax + 0.1 * abs(ymax))  # Add buffer
        # Middle column (psfDiffFlux) gets independent, symmetric scaling
        if all_flux[1]:
            max_abs_flux = np.nanmax(np.abs(all_flux[1]))  # Find the maximum absolute value
            ax[row_idx, 1].set_ylim(-max_abs_flux * 1.1, max_abs_flux * 1.1)  # Symmetric range around 0
[14]:
for _, row in result_df.iterrows():
    fig, ax = plt.subplots(2, 3, figsize=(16, 8), sharex="row")  # 2 rows, 3 columns
    fig.suptitle(
        f"RA={row.ra_var_obj:.5f}, Dec={row.dec_var_obj:.5f}",
        fontsize=16,
    )
    all_flux = plot_flux_lightcurves(ax, row)
    scale_flux_y_axis(ax, all_flux)
    plt.tight_layout()
    plt.show()
About#
Author(s): Sandro Campos, Doug Branton
Last updated on: 7 Jan 2026
If you use lsdb for published research, please cite following instructions.